

Question: Using the following Data, complete the following: 1.Frequency Distribution Table, including the total number of observations 2.Determine the highest and lowest observation value 3.Determine how
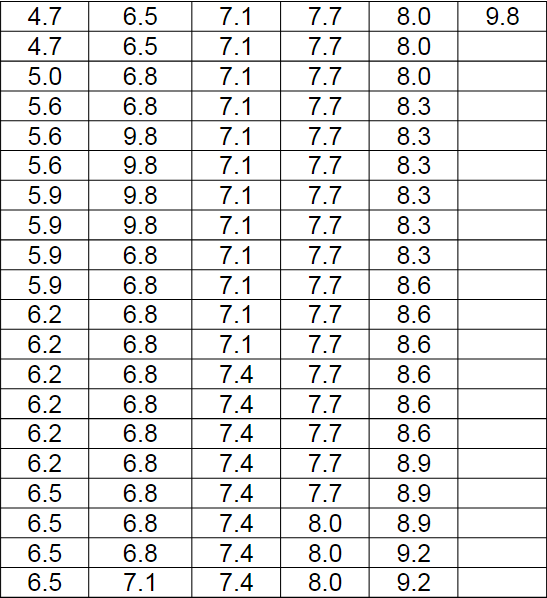
Using the following Data, complete the following:
1.Frequency Distribution Table, including the total number of observations
2.Determine the highest and lowest observation value
3.Determine how may classes are available
4.Develop a Histogram
Step by Step Solution
There are 3 Steps involved in it
1 Expert Approved Answer
Step: 1 Unlock

Question Has Been Solved by an Expert!
Get step-by-step solutions from verified subject matter experts
Step: 2 Unlock
Step: 3 Unlock