

Question: Using the following data: Samples 1 2 3 456 Observations (inspections) 3 5.59 5.09 5.84 5.43 5.26 5.77 1 5.47 5.5 5.38 5.14 5.16
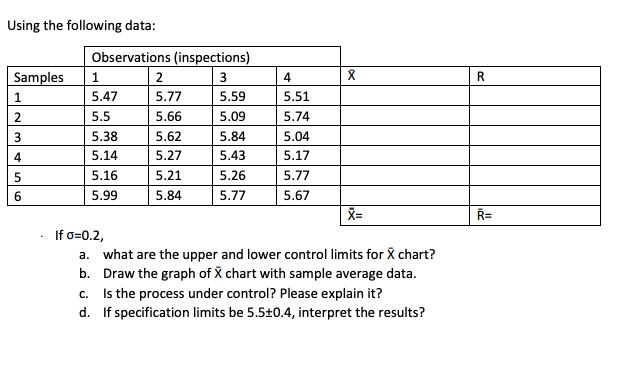
Using the following data: Samples 1 2 3 456 Observations (inspections) 3 5.59 5.09 5.84 5.43 5.26 5.77 1 5.47 5.5 5.38 5.14 5.16 5.99 2 5.77 5.66 5.62 5.27 5.21 5.84 4 5.51 5.74 5.04 5.17 5.77 5.67 X X= If o=0.2, a. what are the upper and lower control limits for X chart? b. Draw the graph of X chart with sample average data. c. Is the process under control? Please explain it? d. If specification limits be 5.50.4, interpret the results? R R=
Step by Step Solution
3.53 Rating (153 Votes )
There are 3 Steps involved in it
The image contains a table of data for observations inspections with four samples taken in each of six rounds To proceed with the questions asked base... View full answer

Get step-by-step solutions from verified subject matter experts