

Question: Using the following dataset (Show your work.): Time Period Demand 27 July August 24 September 19 October 22 November 27 December 22 January 18
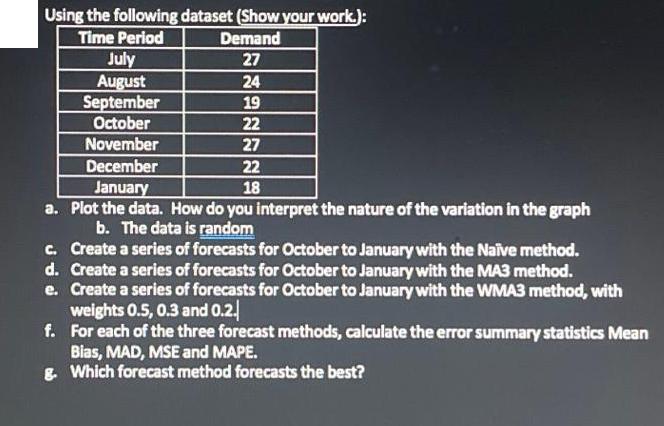
Using the following dataset (Show your work.): Time Period Demand 27 July August 24 September 19 October 22 November 27 December 22 January 18 a. Plot the data. How do you interpret the nature of the variation in the graph b. The data is random c. Create a series of forecasts for October to January with the Nave method. d. Create a series of forecasts for October to January with the MA3 method. e. Create a series of forecasts for October to January with the WMA3 method, with weights 0.5, 0.3 and 0.2. f. For each of the three forecast methods, calculate the error summary statistics Mean Bias, MAD, MSE and MAPE. g. Which forecast method forecasts the best?
Step by Step Solution
3.39 Rating (143 Votes )
There are 3 Steps involved in it
The image you have provided contains a dataset with time period and demand values along with a series of instructions for analyzing the data To address the instructions provided we would proceed as fo... View full answer

Get step-by-step solutions from verified subject matter experts