

Question: Using the following graph, answer the below questions. 200 160 120 Quarterly Sales ($1000s) 80 40 0 0 2 4 6 8 10 TTTTTTT 12
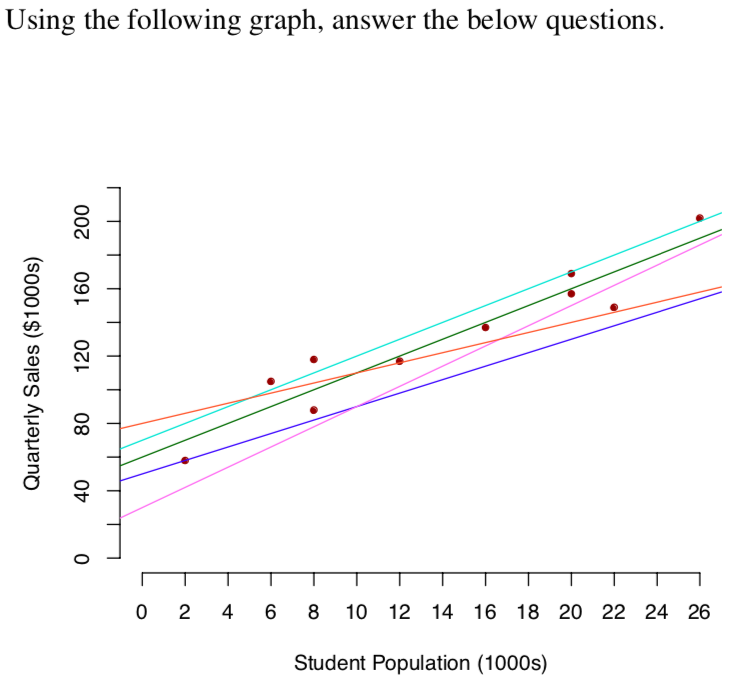
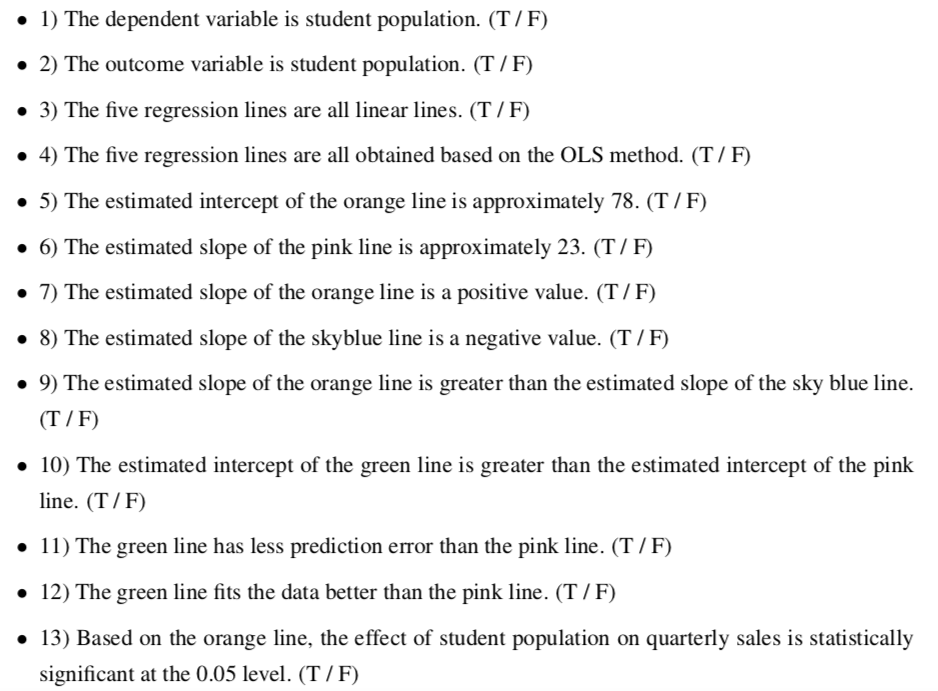

Using the following graph, answer the below questions. 200 160 120 Quarterly Sales ($1000s) 80 40 0 0 2 4 6 8 10 TTTTTTT 12 14 16 18 20 22 24 26 Student Population (1000s) 1) The dependent variable is student population. (T/F) 2) The outcome variable is student population. (T/F) 3) The five regression lines are all linear lines. (T/F) 4) The five regression lines are all obtained based on the OLS method. (T/F) 5) The estimated intercept of the orange line is approximately 78. (T/F) 6) The estimated slope of the pink line is approximately 23. (T/F) 7) The estimated slope of the orange line is a positive value. (T/F) 8) The estimated slope of the skyblue line is a negative value. (T/F) 9) The estimated slope of the orange line is greater than the estimated slope of the sky blue line. (T/F) 10) The estimated intercept of the green line is greater than the estimated intercept of the pink line. (T/F) 11) The green line has less prediction error than the pink line. (T/F) 12) The green line fits the data better than the pink line. (T/F) 13) Based on the orange line, the effect of student population on quarterly sales is statistically significant at the 0.05 level. (T/F) 14) Based on the pink line, the effect of quarterly sales on student population is statistically significant at the 0.05 level. (T/F)
Step by Step Solution
There are 3 Steps involved in it

Get step-by-step solutions from verified subject matter experts