

Question: Using the following operating data for Complex Corporation, illustrate horizontal analysis. HORIZONTAL ANALYSIS 2017 2016 2017 2016 Net sales Cost of goods sold Operating expenses
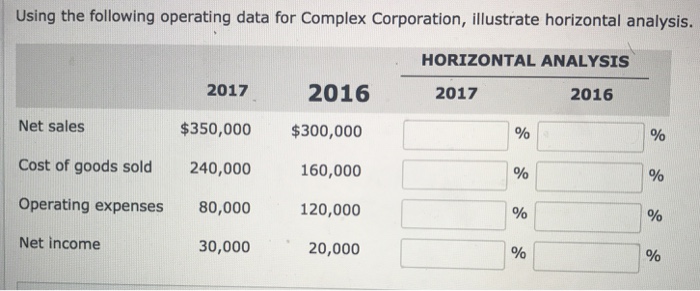
Using the following operating data for Complex Corporation, illustrate horizontal analysis. HORIZONTAL ANALYSIS 2017 2016 2017 2016 Net sales Cost of goods sold Operating expenses Net income $350,000 $300,000 240,000 80,000 30,000 160,000 120,000 20,000
Step by Step Solution
There are 3 Steps involved in it
1 Expert Approved Answer
Step: 1 Unlock

Question Has Been Solved by an Expert!
Get step-by-step solutions from verified subject matter experts
Step: 2 Unlock
Step: 3 Unlock