

Question: Using the following table and Excel scenario manager function to conduct a scenario analysis. In this analysis, please cover worst, expected, and best scenario. Please
Using the following table and Excel scenario manager function to conduct a scenario analysis. In this analysis, please cover worst, expected, and best scenario. Please make sure to change the cell references in the scenario summary table to proper variable names so your results are understandable.
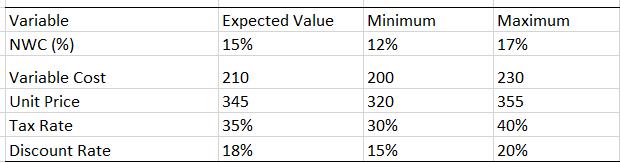
Variable NWC (%) Variable Cost Unit Price Tax Rate Discount Rate Expected Value 15% 210 345 35% 18% Minimum 12% 200 320 30% 15% Maximum 17% 230 355 40% 20%
Step by Step Solution
3.52 Rating (159 Votes )
There are 3 Steps involved in it
From From Other Existing Text Sources Connections Get External Data 18 WE NETHE ... View full answer

Get step-by-step solutions from verified subject matter experts