

Question: Using the given cash flow projection in Exhibit 10 to prepare a discounted cash flow valuation (terminal value should be based on perpetuity growth method
Using the given cash flow projection in Exhibit 10 to prepare a discounted cash flow valuation (terminal value should be based on perpetuity growth method and Exit EBITDA Multiples) for Rosetta Stone and prepare the sensitivity test on both terminal growth rate and Terminal EBITDA Multiples. (35 points)
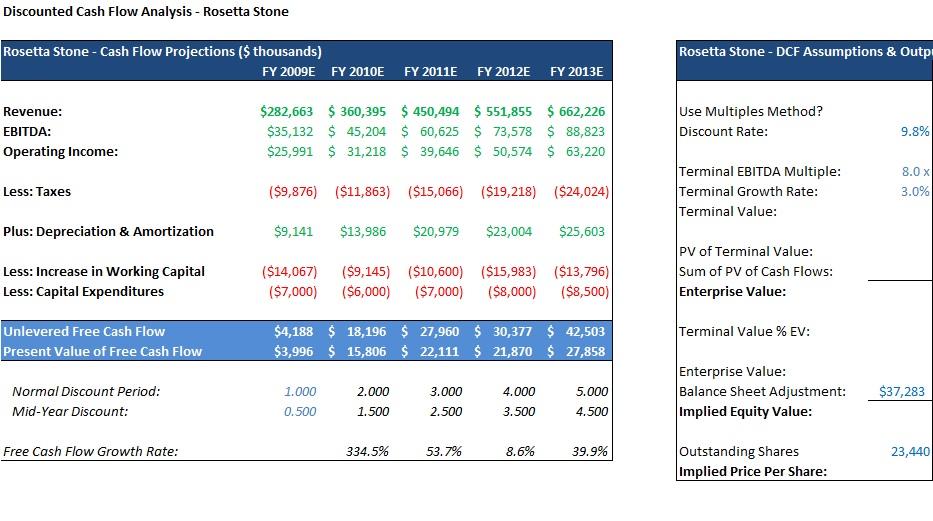
Discounted Cash Flow Analysis - Rosetta Stone Rosetta Stone - Cash Flow Projections ($ thousands) Revenue: EBITDA: Operating Income: Less: Taxes Plus: Depreciation & Amortization Less: Increase in Working Capital Less: Capital Expenditures Unlevered Free Cash Flow Present Value of Free Cash Flow Normal Discount Period: Mid-Year Discount: Free Cash Flow Growth Rate: FY 2009E FY 2010E 1.000 0.500 FY 2011E $282,663 $ 360,395 $450,494 $ 551,855 $ 662,226 $35,132 $ 45,204 $ 60,625 $ 73,578 $ 88,823 $25,991 $ 31,218 $ 39,646 $ 50,574 $ 63,220 ($9,876) ($11,863) ($15,066) ($19,218) ($24,024) $9,141 $13,986 $20,979 $23,004 $25,603 ($14,067) ($9,145) ($10,600) ($15,983) ($13,796) ($7,000) ($6,000) ($7,000) ($8,000) ($8,500) 2.000 1.500 $4,188 $ 18,196 $ 27,960 $ 30,377 $ 42,503 $3,996 $ 15,806 $ 22,111 $21,870 $ 27,858 334.5% FY 2012E 3.000 2.500 53.7% FY 2013E 4.000 3.500 8.6% 5.000 4.500 39.9% Rosetta Stone - DCF Assumptions & Outp Use Multiples Method? Discount Rate: Terminal EBITDA Multiple: Terminal Growth Rate: Terminal Value: PV of Terminal Value: Sum of PV of Cash Flows: Enterprise Value: Terminal Value % EV: Enterprise Value: Balance Sheet Adjustment: Implied Equity Value: Outstanding Shares Implied Price Per Share: 9.8% 8.0 x 3.0% $37,283 23,440 Discounted Cash Flow Analysis - Rosetta Stone Rosetta Stone - Cash Flow Projections ($ thousands) Revenue: EBITDA: Operating Income: Less: Taxes Plus: Depreciation & Amortization Less: Increase in Working Capital Less: Capital Expenditures Unlevered Free Cash Flow Present Value of Free Cash Flow Normal Discount Period: Mid-Year Discount: Free Cash Flow Growth Rate: FY 2009E FY 2010E 1.000 0.500 FY 2011E $282,663 $ 360,395 $450,494 $ 551,855 $ 662,226 $35,132 $ 45,204 $ 60,625 $ 73,578 $ 88,823 $25,991 $ 31,218 $ 39,646 $ 50,574 $ 63,220 ($9,876) ($11,863) ($15,066) ($19,218) ($24,024) $9,141 $13,986 $20,979 $23,004 $25,603 ($14,067) ($9,145) ($10,600) ($15,983) ($13,796) ($7,000) ($6,000) ($7,000) ($8,000) ($8,500) 2.000 1.500 $4,188 $ 18,196 $ 27,960 $ 30,377 $ 42,503 $3,996 $ 15,806 $ 22,111 $21,870 $ 27,858 334.5% FY 2012E 3.000 2.500 53.7% FY 2013E 4.000 3.500 8.6% 5.000 4.500 39.9% Rosetta Stone - DCF Assumptions & Outp Use Multiples Method? Discount Rate: Terminal EBITDA Multiple: Terminal Growth Rate: Terminal Value: PV of Terminal Value: Sum of PV of Cash Flows: Enterprise Value: Terminal Value % EV: Enterprise Value: Balance Sheet Adjustment: Implied Equity Value: Outstanding Shares Implied Price Per Share: 9.8% 8.0 x 3.0% $37,283 23,440
Step by Step Solution
There are 3 Steps involved in it

Get step-by-step solutions from verified subject matter experts