

Question: using the given data please complete the data that is blank at the bottom for years 2001-2005 Exhibit 3 INCOME STATEMENT (millions of $) Sales
using the given data please complete the data that is blank at the bottom for years 2001-2005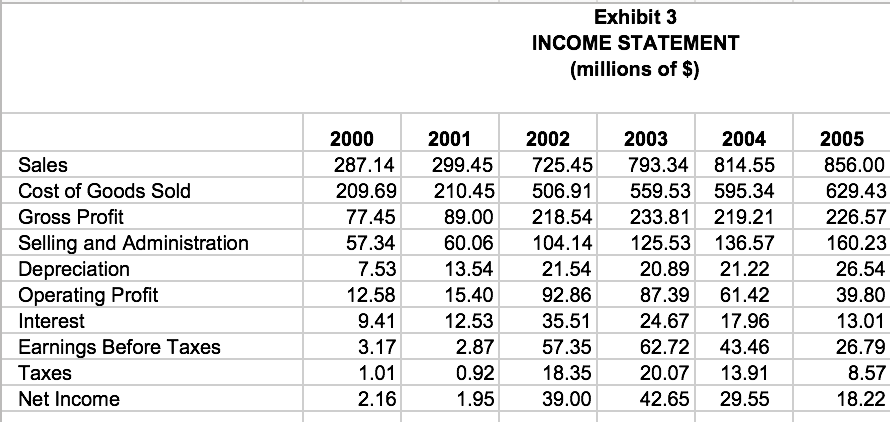
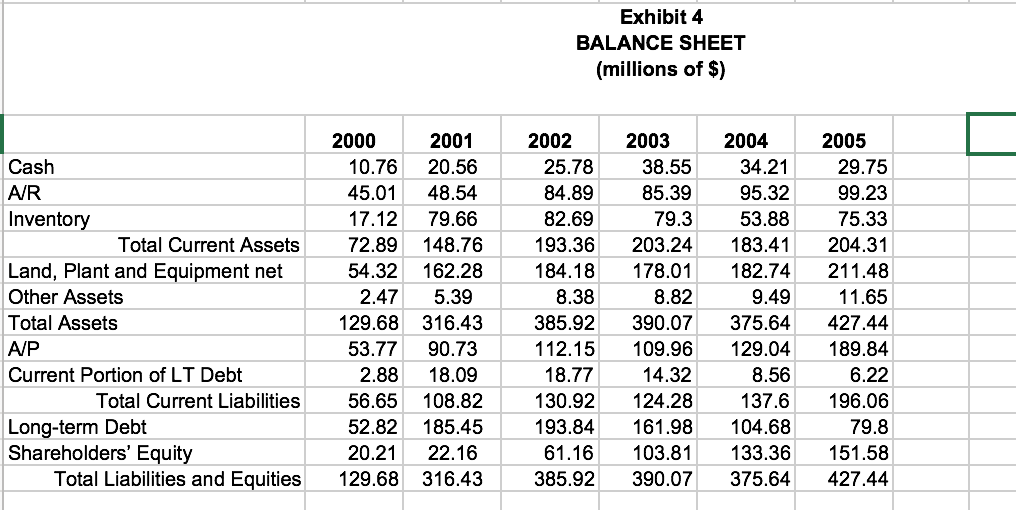
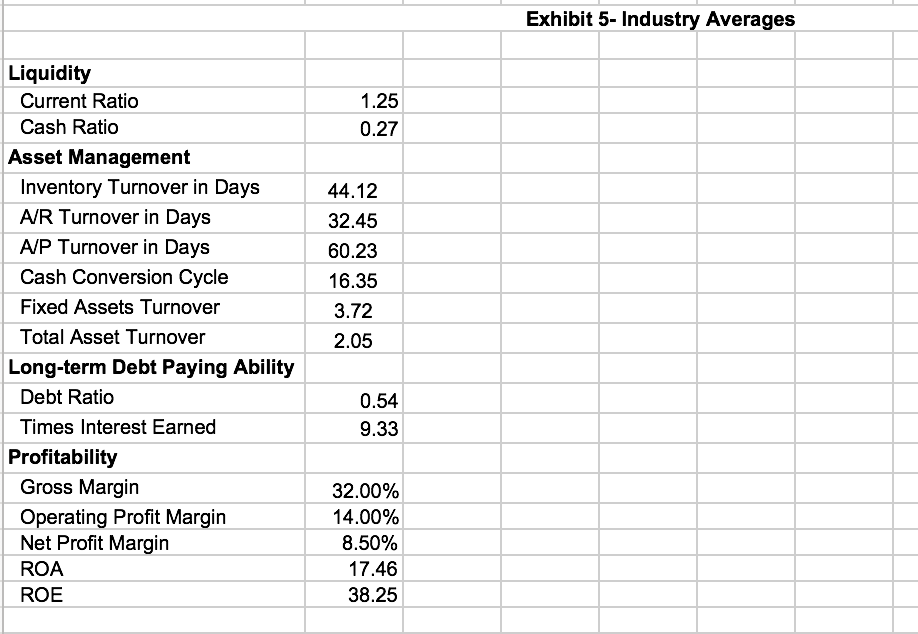
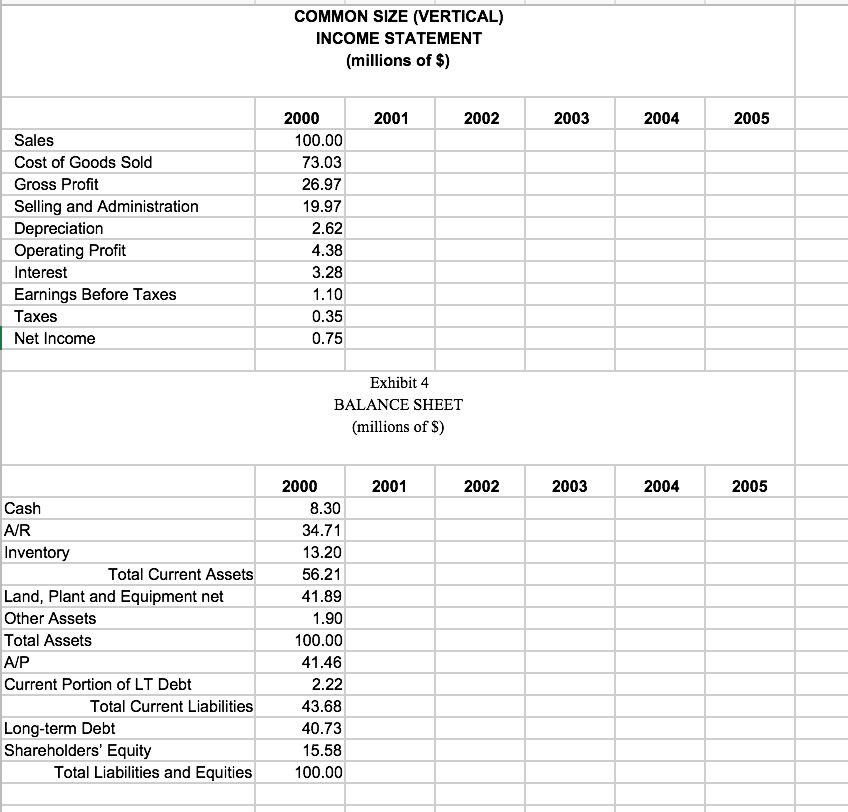
Exhibit 3 INCOME STATEMENT (millions of $) Sales Cost of Goods Sold Gross Profit Selling and Administration Depreciation Operating Profit Interest Earnings Before Taxes Taxes Net Income 2000 287.14 209.69 77.45 57.34 7.53 12.58 9.41 3.17 1.01 2.16 2001 299.45 210.45 89.00 60.06 13.54 15.40 12.53 2.87 0.92 1.95 2002 725.45 506.91 218.54 104.14 21.54 92.86 35.51 57.35 18.35 39.00 2003 793.34 559.53 233.81 125.53 20.89 87.39 24.67 62.72 20.07 42.65 2004 814.55 595.34 219.21 136.57 21.22 61.42 17.96 43.46 13.91 29.55 2005 856.00 629.43 226.57 160.23 26.54 39.80 13.01 26.79 8.57 18.22 Exhibit 4 BALANCE SHEET (millions of $) Cash AR Inventory Total Current Assets Land, Plant and Equipment net Other Assets Total Assets AVP Current Portion of LT Debt Total Current Liabilities Long-term Debt Shareholders' Equity Total Liabilities and Equities 2000 10.76 45.01 17.12 72.89 54.32 2.47 129.68 53.77 2.88 56.65 52.82 20.21 129.68 2001 20.56 48.54 79.66 148.76 162.28 5.39 316.43 90.73 18.09 108.82 185.45 22.16 316.43 2002 25.78 84.89 82.69 193.36 184.18 8.38 385.92 112.15 18.77 130.92 193.84 61.16 385.92 2003 38.55 85.39 79.3 203.24 178.01 8.82 390.07 109.96 14.32 124.28 161.98 103.81 390.07 2004 34.21 95.32 53.88 183.41 182.74 9.49 375.64 129.04 8.56 137.6 104.68 133.36 375.64 2005 29.75 99.23 75.33 204.31 211.48 11.65 427.44 189.84 6.22 196.06 79.8 151.58 427.44 Exhibit 5- Industry Averages 1.25 0.27 Liquidity Current Ratio Cash Ratio Asset Management Inventory Turnover in Days A/R Turnover in Days A/P Turnover in Days Cash Conversion Cycle Fixed Assets Turnover Total Asset Turnover Long-term Debt Paying Ability Debt Ratio Times Interest Earned Profitability Gross Margin Operating Profit Margin Net Profit Margin ROA ROE 44.12 32.45 60.23 16.35 3.72 2.05 0.54 9.33 32.00% 14.00% 8.50% 17.46 38.25 COMMON SIZE (VERTICAL) INCOME STATEMENT (millions of $) 2001 2002 2003 2004 2005 Sales Cost of Goods Sold Gross Profit Selling and Administration Depreciation Operating Profit Interest Earnings Before Taxes Taxes Net Income 2000 100.00 73.03 26.97 19.97 2.62 4.38 3.28 1.10 0.35 0.75 Exhibit 4 BALANCE SHEET (millions of $) 2001 2002 2003 2004 2005 Cash A/R Inventory Total Current Assets Land, Plant and Equipment net Other Assets Total Assets A/P Current Portion of LT Debt Total Current Liabilities Long-term Debt Shareholders' Equity Total Liabilities and Equities 2000 8.30 34.71 13.20 56.21 41.89 1.90 100.00 41.46 2.22 43.68 40.73 15.58 100.00
Step by Step Solution
There are 3 Steps involved in it

Get step-by-step solutions from verified subject matter experts