

Question: Using the given data to make a standard curve in Excel, and use Trendline to add a linear regression with the equation. Then use the
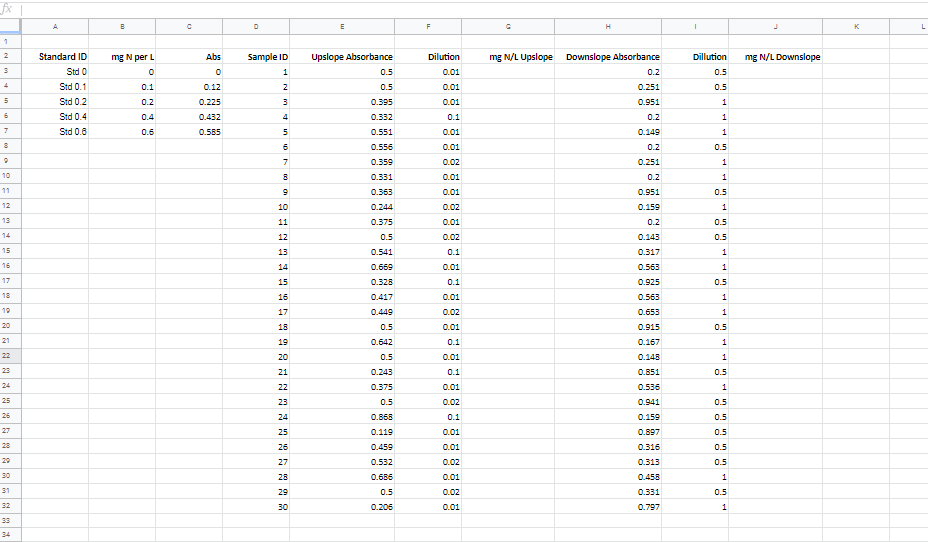
Using the given data to make a standard curve in Excel, and use Trendline to add a linear regression with the equation. Then use the standard curve and the dilutions to determine the concentration ofNO3-in all the samples. Using the data analysis tool pack, perform the appropriate t-test to deduce if the nitrate concentration upslope is less than or greater than the nitrate concentration downslope. When performing a t-test using the data analysis tool pack, the output will include the means for both groups.
What is the averageNO3-concentration at the upslope site?
- Report your answer, from the data analysis toolpakoutput, to 3 decimal places
What is the averageNO3-concentration at the downslope site?
- Report your answer, from the data analysis tool pakoutput, to 3 decimal places
Given the EPA drinking water quality standard is 10 mg/L of nitrate, is the upslope site safe to drink based only on nitrate content?(Enteryesorno)
Is the downslope site safe to drink, based only onNO3-concentration?(Enteryesorno)
Assuming the two sites are hydrologically well connected, the transit time between the two sites is fast, and the two sites cannot be treated as independent samples, what kind of t-test should be performed to show that the upslope site is greater than the downslope site? Enter the letter of your answer choice in the answer blank
A. one-tailed unpaired t-test
B. two-tailed unpaired t-test
C. one-tailed paired t-test
D. two-tailed paired t-test
What is the calculated t statistic, rounded to 4 decimal places?
Is the calculated t statisticgreaterorlessthan the critical t value reported by the data analysis tool pack?(entergreaterorless)
Is the nitrate concentration at the upslope site significantly greater than the downslope site?(Enteryesorno)
\f
Step by Step Solution
There are 3 Steps involved in it

Get step-by-step solutions from verified subject matter experts