

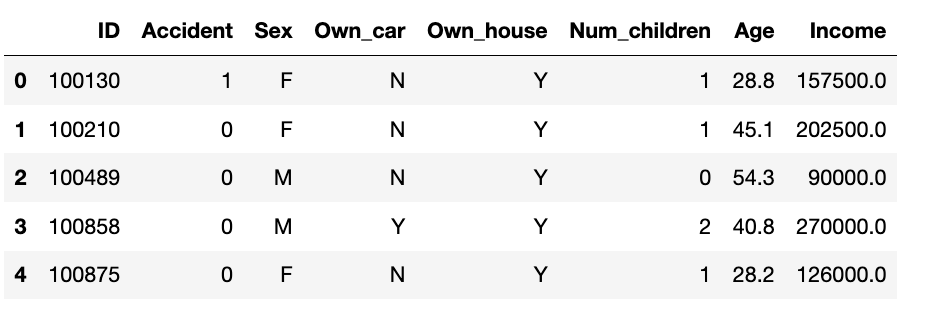
Question: Using the given dataframe in Python, plot a histogram representing age distribution for males and females using 1 2 bins, as in the figure below.
Using the given dataframe in Python, plot a histogram representing age distribution for males and females using bins, as in the figure below. Then plot a second histogram representing income for males and females using bins, as in the figure below. Both plots should include a legend and a title.
Step by Step Solution
There are 3 Steps involved in it
1 Expert Approved Answer
Step: 1 Unlock

Question Has Been Solved by an Expert!
Get step-by-step solutions from verified subject matter experts
Step: 2 Unlock
Step: 3 Unlock