

Question: using the given information in table, calculate the mean return, standard deviation, covariance and correlation for given stocks. 2009 2010 2011 2012 2013 2014 2015
using the given information in table, calculate the mean return, standard deviation, covariance and correlation for given stocks. 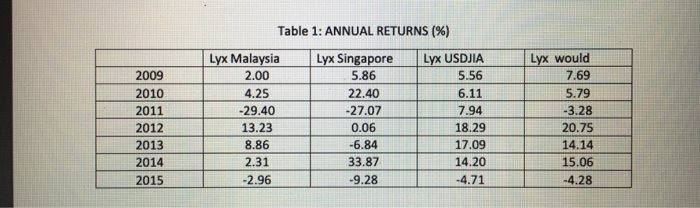
2009 2010 2011 2012 2013 2014 2015 Table 1: ANNUAL RETURNS (%) Lyx Malaysia Lyx Singapore Lyx USDJIA 2.00 5.86 5.56 4.25 22.40 6.11 -29.40 -27.07 7.94 13.23 0.06 18.29 8.86 -6.84 17.09 2.31 33.87 14.20 -2.96 -9.28 -4.71 Lyx would 7.69 5.79 -3.28 20.75 14.14 15.06 -4.28
Step by Step Solution
There are 3 Steps involved in it
1 Expert Approved Answer
Step: 1 Unlock

Question Has Been Solved by an Expert!
Get step-by-step solutions from verified subject matter experts
Step: 2 Unlock
Step: 3 Unlock