

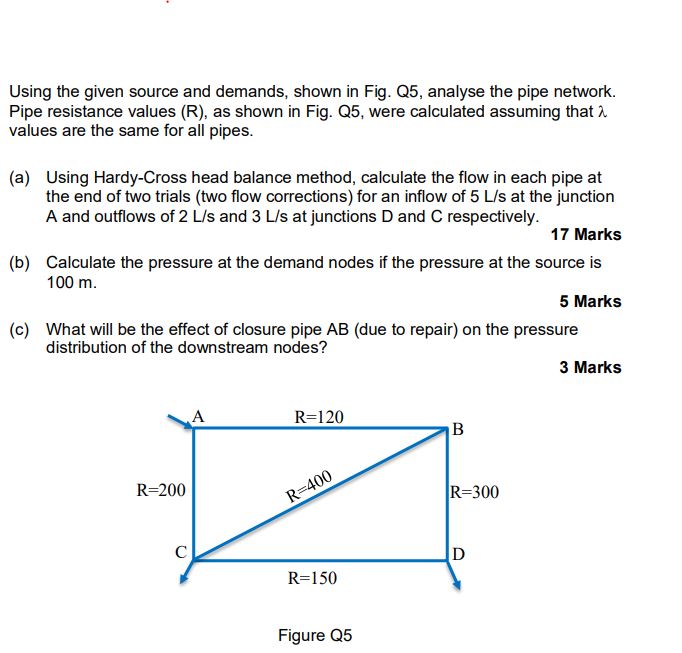
Question: Using the given source and demands, shown in Fig. Q 5 , analyse the pipe network. Pipe resistance values ( R ) , as shown
Using the given source and demands, shown in Fig. Q analyse the pipe network.
Pipe resistance values R as shown in Fig. Q were calculated assuming that lambda
values are the same for all pipes.
a Using HardyCross head balance method, calculate the flow in each pipe at
the end of two trials two flow corrections for an inflow of Ls at the junction
A and outflows of Ls and Ls at junctions D and C respectively.
b Calculate the pressure at the demand nodes if the pressure at the source is
m
c What will be the effect of closure pipe AB due to repair on the pressure
distribution of the downstream nodes?
Step by Step Solution
There are 3 Steps involved in it
1 Expert Approved Answer
Step: 1 Unlock

Question Has Been Solved by an Expert!
Get step-by-step solutions from verified subject matter experts
Step: 2 Unlock
Step: 3 Unlock