

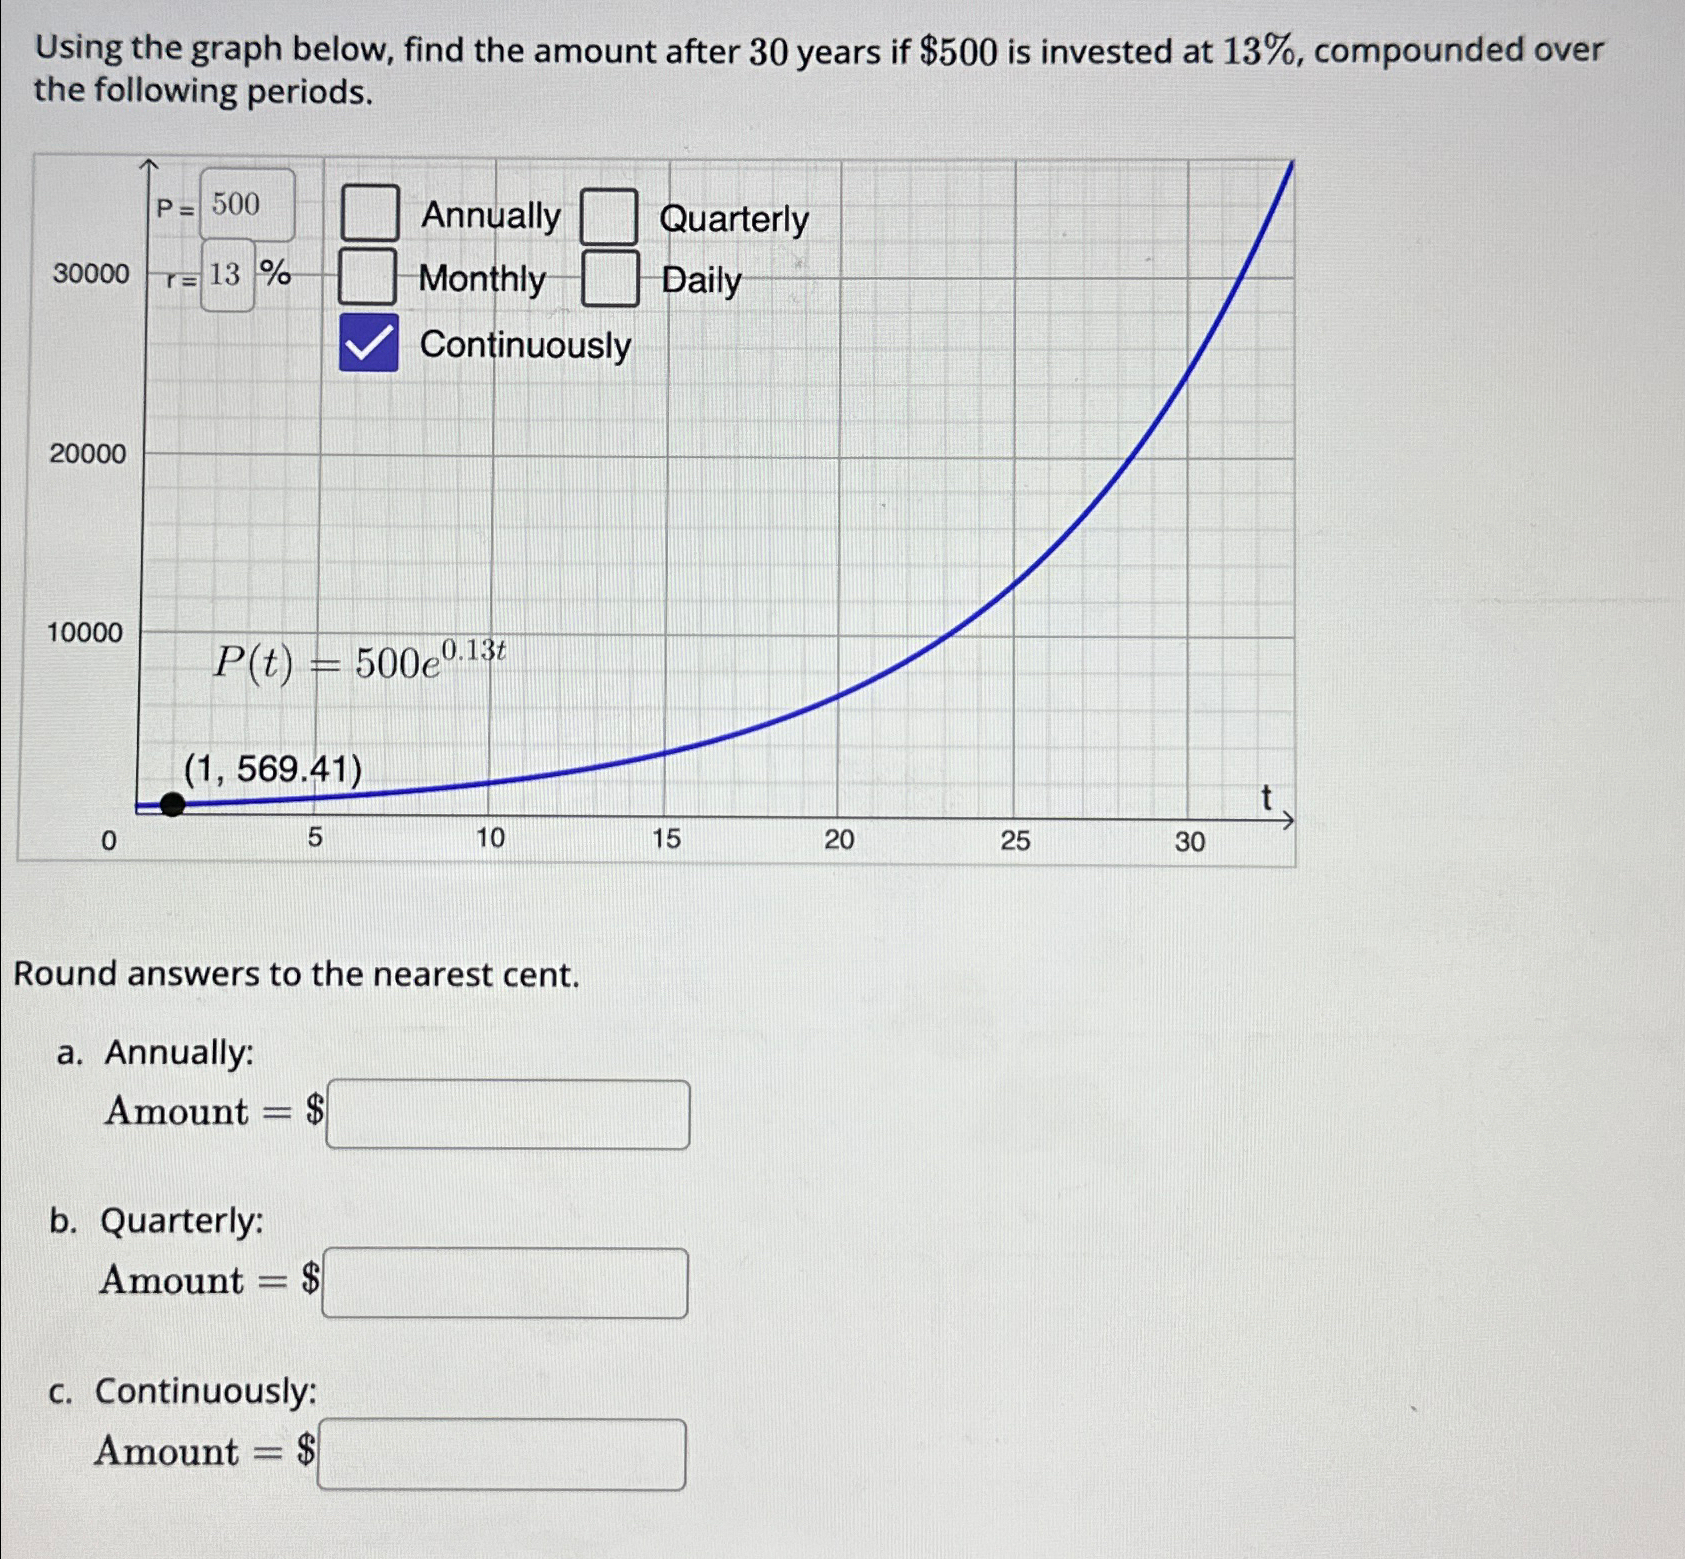
Question: Using the graph below, find the amount after 3 0 years if $ 5 0 0 is invested at 1 3 % , compounded over
Using the graph below, find the amount after years if $ is invested at compounded over the following periods.
Round answers to the nearest cent.
a Annually:
Amount $
b Quarterly:
Amount $
c Continuously:
Amount $
Step by Step Solution
There are 3 Steps involved in it
1 Expert Approved Answer
Step: 1 Unlock

Question Has Been Solved by an Expert!
Get step-by-step solutions from verified subject matter experts
Step: 2 Unlock
Step: 3 Unlock