

Question: Using the graph, determine the type of good X. The price increases from P0 to P1. The substitution effect lS illustrated by the change in
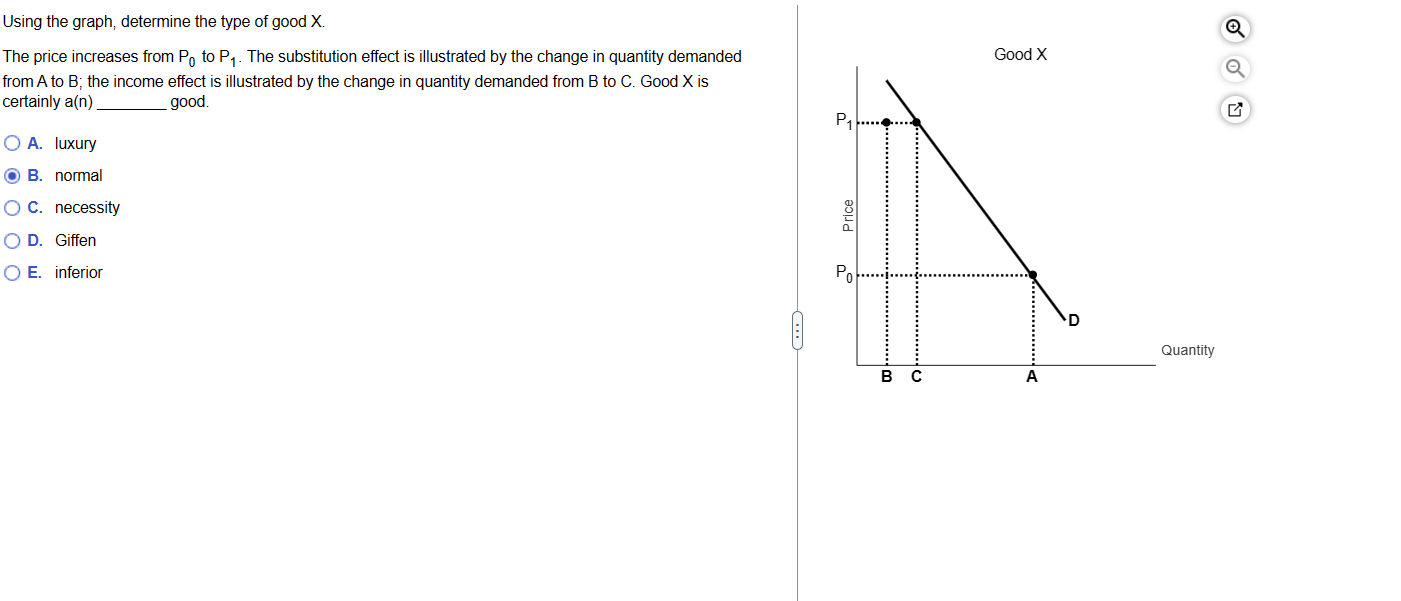
Using the graph, determine the type of good X. The price increases from P0 to P1. The substitution effect lS illustrated by the change in quantity demanded from Ate B; the income effect is illustrated by the change in quantity demanded from B to C. Good X is certainly a(n) good '32:) A. luxury c1 B. normal {I C. necessity {I D. Gifien {1 E. Inferior Goad X Quantity ,9
Step by Step Solution
There are 3 Steps involved in it
1 Expert Approved Answer
Step: 1 Unlock

Question Has Been Solved by an Expert!
Get step-by-step solutions from verified subject matter experts
Step: 2 Unlock
Step: 3 Unlock