

Question: Using the graphing document, identify the graph that best demonstrates the impact of a large wildfire that destroys one of the largest avocado orchards on
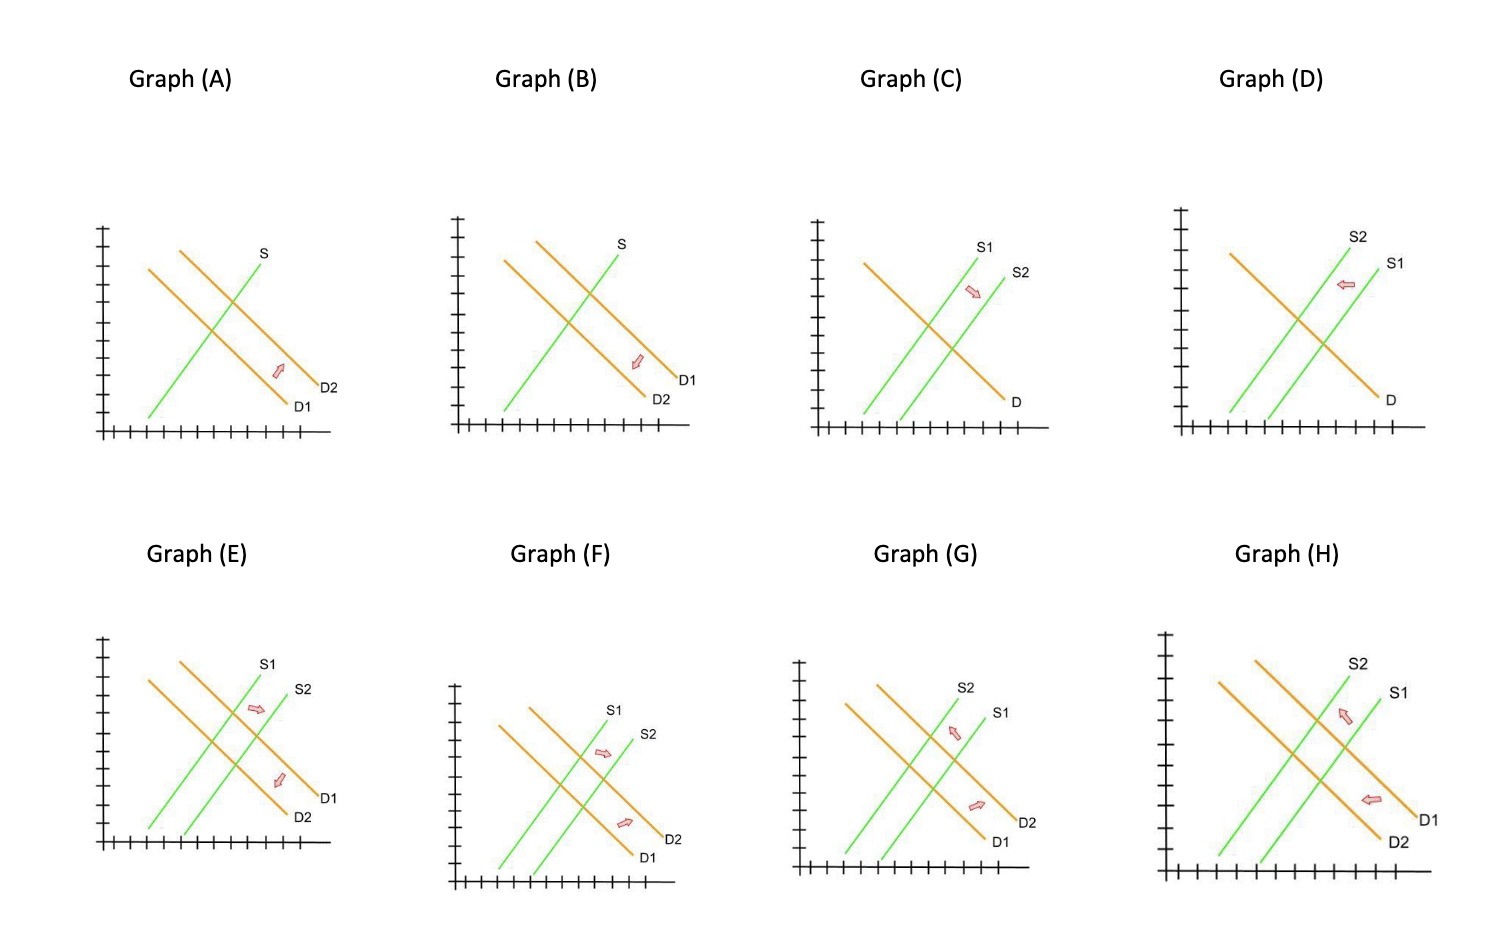
Using the graphing document, identify the graph that best demonstrates the impact of a large wildfire that destroys one of the largest avocado orchards on the market for guacamole.
What do you predict will happen to equilibrium price and quantity as a result of this change?
Step by Step Solution
There are 3 Steps involved in it
1 Expert Approved Answer
Step: 1 Unlock

Question Has Been Solved by an Expert!
Get step-by-step solutions from verified subject matter experts
Step: 2 Unlock
Step: 3 Unlock