

Question: Using the graphs how do I explain the following: No matter what JointXY you go with, you are guaranteed that either some of the values
Using the graphs how do I explain the following:
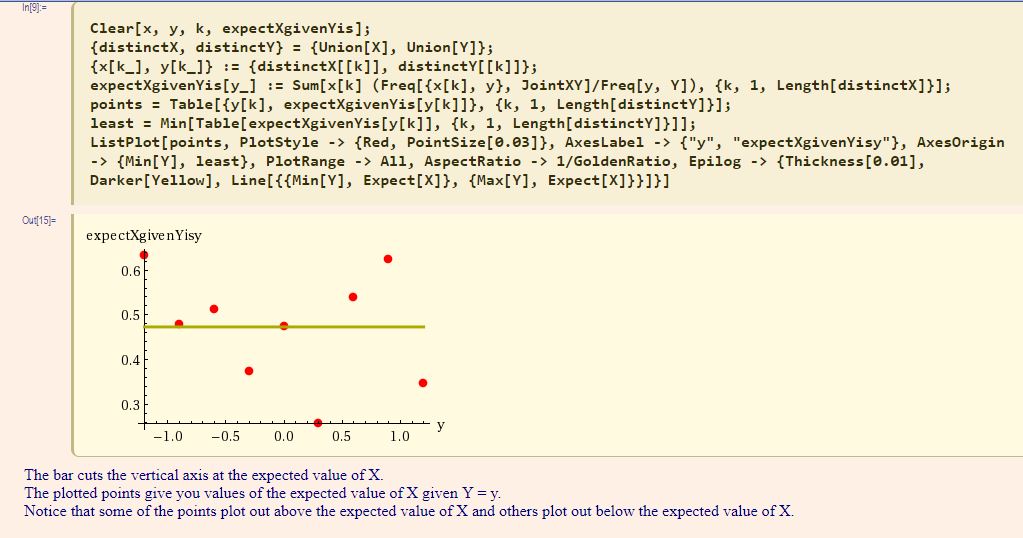
No matter what JointXY you go with, you are guaranteed that either some of the values of the expected value of X given Y = y will plot out above the expected value of X and others plot out below the expected value of X or all of the values of the expected value of X given Y = y plot out on the expected value of X.?
\f\f
Step by Step Solution
There are 3 Steps involved in it
1 Expert Approved Answer
Step: 1 Unlock

Question Has Been Solved by an Expert!
Get step-by-step solutions from verified subject matter experts
Step: 2 Unlock
Step: 3 Unlock