

Question: USING THE GRAPHS IN THE SECOND PICTURE, PROVIDE SQL QUERIES BY ANSWERING THE QUESTIONS IN THE FIRST PICTURE: 8 . Display the total sales for
USING THE GRAPHS IN THE SECOND PICTURE, PROVIDE SQL QUERIES BY ANSWERING THE QUESTIONS IN THE FIRST PICTURE:
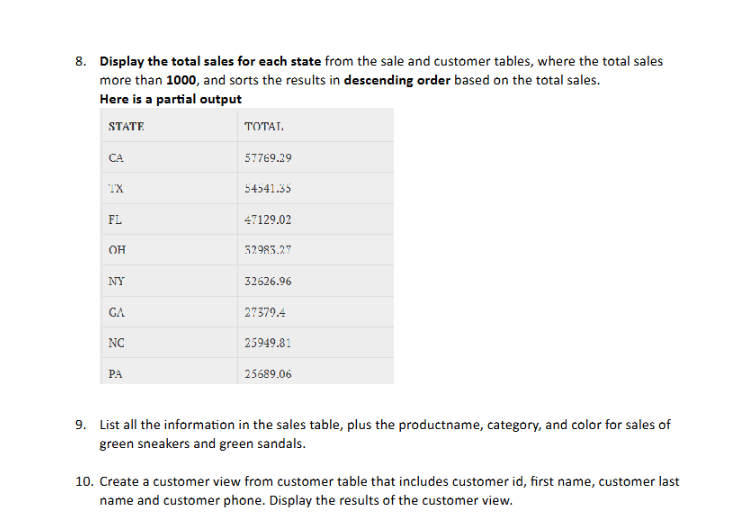
Display the total sales for each state from the sale and customer tables, where the total sales more than and sorts the results in descending order based on the total sales.
Here is a partial output
List all the information in the sales table, plus the productname, category, and color for sales of green sneakers and green sandals.
Create a customer view from customer table that includes customer id first name, customer last name and customer phone. Display the results of the customer view.
Step by Step Solution
There are 3 Steps involved in it
1 Expert Approved Answer
Step: 1 Unlock

Question Has Been Solved by an Expert!
Get step-by-step solutions from verified subject matter experts
Step: 2 Unlock
Step: 3 Unlock