Question: Using the Households Data, perform a correlation matrix including all variables except ID. Which variables seem promising for a possible independent variable that explains Income.
- Using the Households Data, perform a correlation matrix including all variables except ID. Which variables seem promising for a possible independent variable that explains Income.
- Prepare scatter plot showing the relationship between income and a variable you identified in part (1). Properly format (trend line with equation, modify variable names rather than x & y, axes labels, etc.) Interpret the graph.
- Using forward stepwise procedure, develop a multi-regression model that explains income variable. For each variable added there should a separate regression result sheet.
- Why/how did you decide the variables in part (3) for your model? In other words, explain your reasoning.
- What is the Adjusted R square of your model? What does it mean?
- Is your model significant? Find (and state) the F-table value and compare it to the F-value in the model. Interpret the comparison.
- Are the independent variables individually significant?
- Write the regression equation.
- For the scenario below predict the salary of Debbie according to your model.
"Debbie recently graduated from the marine biology program of the University of California. Being an environmentalist, she decided to work for a non-profit organization called "Save Our Oceans". Being single, she lives in a 2-bedroom house with her cat, fish, and parrot (here think about a parrot joke and smile !). She commutes for about 30 minutes a day in her Toyota Prius. She works 40 hours a week."
10. Considering all independent variables, does there appear to be any multicollinearity among the independent variables? If so, which of the pairs of independent variables indicate multicollinearity?
Data Set Links and a Pictures
www.kaggle.com/dataset/8310dab9e87428e839ebfab48fccd40383466f3c3d14fe85fafbbb594dc1ee62
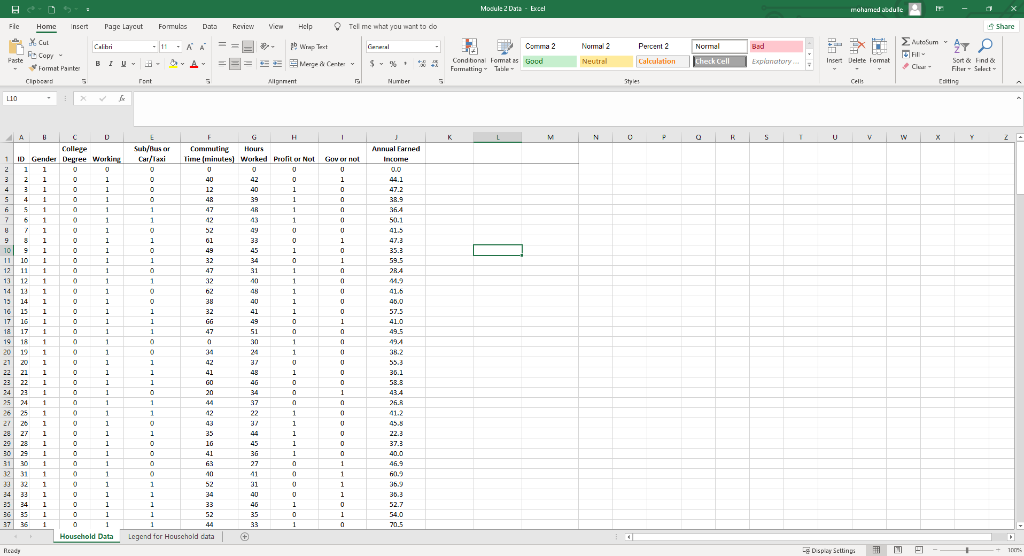
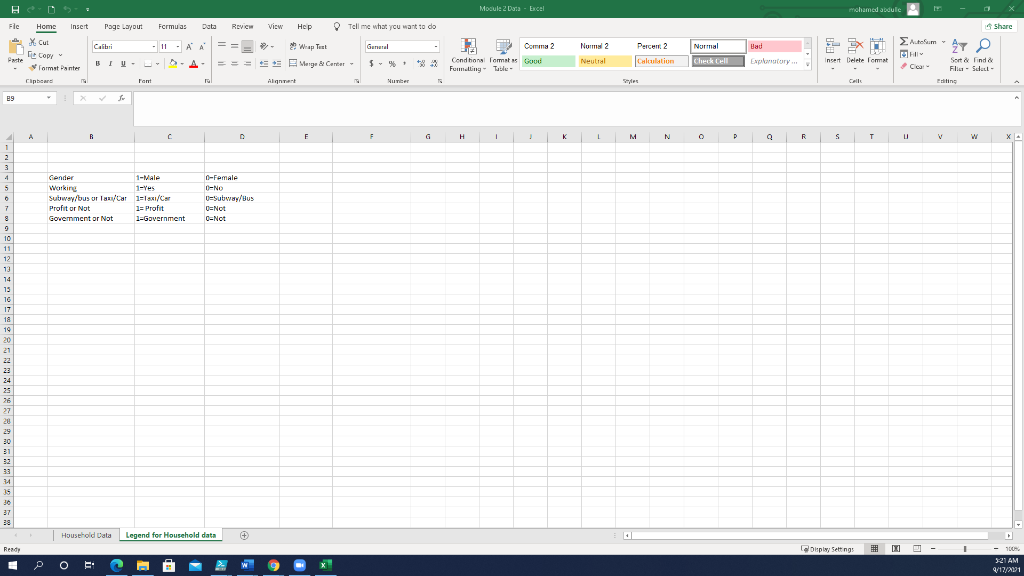
Module 2 Duta - Excel mohamed akdule Pic Home Insert Page Layout Fomus Data Review View Help Tell me what you want to do Share X cul Calibri 2- General Bad e Co Normal 2 Neutral = 1 W Text === E Merge Cehe Allgement Comma 2 Cond bonal Formats Good Formatting Table Percent 2 Calculation Normal Check Cell - EX F Insert Delete Format BIV Paste Format Painter Clipboard $. + Exploratory Sort & Find & Fiber - Select Celting Font Nurher Cell LIO M N D P E U V W X Guverhot 0 1 0 0 0 U 1 0 1 0 0 0 0 0 1 A U College 1 ID Gender Degree Working 2 1 1 1 0 3 1 O 1 4 4 31 0 1 S 4 10 1 6 5 1 a 1 7 6 1 0 1 u 1 1 1 9 3 1 0 1 1 10 9 10 1 11 10 10 1 12 11 10 1 13 12 1 0 1 14 13 1 1 13 14 1 O 1 16 15 10 1 17 17 16 i 0 1 18 17 1 0 0 1 19 11 a 1 20 19 1 o 1 21 20 10 1 22 21 0 1 22 1 1 1 24 23 1 0 1 25 21 a 1 26 1 a 1 27 26 1 0 1 28 27 1 0 1 28 1 0 1 30 29 10 1 31 30 1 0 1 32 31 1 a a 1 33 32 1 0 1 34 33 1 O 1 35 34 1 0 1 36 35 1 1 37 36 1 0 1 Household Data G H Sub/s Commuting Hours Car/laxi Time minutes) Worked Profit or Not 0 0 0 0 40 42 O O 0 12 40 1 0 48 39 1 - 1 47 4R 1 1 12 1 0 52 99 0 1 01 33 0 0 49 45 1 1 32 0 0 47 31 1 1 32 10 1 62 48 1 0 38 90 1 1 1 32 41 1 1 GG 49 0 1 47 51 0 0 a 30 1 1 0 34 1 1 42 37 0 1 41 48 1 1 GO 4G 0 0 20 34 0 0 1 44 37 0 1 12 22 1 43 37 1 1 35 44 1 0 1G 45 1 41 3G 1 0 63 27 0 0 10 11 1 52 31 0 1 34 40 0 1 33 46 1 1 52 35 0 44 33 1 Legend for Household cata + a 0 0 Annual Farned Inime 00 44.1 47.2 38.9 364 50.1 41.5 47.3 35.2 59.5 PRA 14.9 41.5 46.0 57.5 41.0 49.5 49.4 38.2 55.2 30.1 58.3 43.4 26.0 41.2 45.5 22.3 37.3 40.0 46.9 60.9 35.9 35.3 32.7 54.0 20.5 O 0 1 a U 0 0 0 1 1 1 1 0 1 1 a Ready Dispy Settings N Tres Module 2 Data - Excel mohamed abdulle Fic Home Insert Page Layout Formula Data Review View Tell me what you want to do Share - Calibri - 11-AA == h Wrap Test Gunnal Nume 2 Normal Bad X. Cut t Copy Paste farms Panter Percent 2 Calculation Comma 2 Condhana Tomat Goud Formatting Titlu IV- -A- ===Merge Carter % 3 Neutral Check Cell Emory. Insert Delete comma Sort find Filiu - Sd Clipboard Fant Alq Number Editing 89 A B C F H K M N P R s T u V x 1 2 3 4 5 0 7 8 Gender 1-Male Working 1-Yes Subway/bus or w/ Car =11/C Profit or Not 1= Profit Goverment or Not Government 0-Female DENO U=Subway/ O=Not CENot 10 11 12 13 74 13 16 17 18 19 20 21 24 26 27 28 30 31 23 33 34 35 36 37 Household DataLegend for Household data (+ Ready Display Settings P 100 21 AM 0/17/2221 O Module 2 Duta - Excel mohamed akdule Pic Home Insert Page Layout Fomus Data Review View Help Tell me what you want to do Share X cul Calibri 2- General Bad e Co Normal 2 Neutral = 1 W Text === E Merge Cehe Allgement Comma 2 Cond bonal Formats Good Formatting Table Percent 2 Calculation Normal Check Cell - EX F Insert Delete Format BIV Paste Format Painter Clipboard $. + Exploratory Sort & Find & Fiber - Select Celting Font Nurher Cell LIO M N D P E U V W X Guverhot 0 1 0 0 0 U 1 0 1 0 0 0 0 0 1 A U College 1 ID Gender Degree Working 2 1 1 1 0 3 1 O 1 4 4 31 0 1 S 4 10 1 6 5 1 a 1 7 6 1 0 1 u 1 1 1 9 3 1 0 1 1 10 9 10 1 11 10 10 1 12 11 10 1 13 12 1 0 1 14 13 1 1 13 14 1 O 1 16 15 10 1 17 17 16 i 0 1 18 17 1 0 0 1 19 11 a 1 20 19 1 o 1 21 20 10 1 22 21 0 1 22 1 1 1 24 23 1 0 1 25 21 a 1 26 1 a 1 27 26 1 0 1 28 27 1 0 1 28 1 0 1 30 29 10 1 31 30 1 0 1 32 31 1 a a 1 33 32 1 0 1 34 33 1 O 1 35 34 1 0 1 36 35 1 1 37 36 1 0 1 Household Data G H Sub/s Commuting Hours Car/laxi Time minutes) Worked Profit or Not 0 0 0 0 40 42 O O 0 12 40 1 0 48 39 1 - 1 47 4R 1 1 12 1 0 52 99 0 1 01 33 0 0 49 45 1 1 32 0 0 47 31 1 1 32 10 1 62 48 1 0 38 90 1 1 1 32 41 1 1 GG 49 0 1 47 51 0 0 a 30 1 1 0 34 1 1 42 37 0 1 41 48 1 1 GO 4G 0 0 20 34 0 0 1 44 37 0 1 12 22 1 43 37 1 1 35 44 1 0 1G 45 1 41 3G 1 0 63 27 0 0 10 11 1 52 31 0 1 34 40 0 1 33 46 1 1 52 35 0 44 33 1 Legend for Household cata + a 0 0 Annual Farned Inime 00 44.1 47.2 38.9 364 50.1 41.5 47.3 35.2 59.5 PRA 14.9 41.5 46.0 57.5 41.0 49.5 49.4 38.2 55.2 30.1 58.3 43.4 26.0 41.2 45.5 22.3 37.3 40.0 46.9 60.9 35.9 35.3 32.7 54.0 20.5 O 0 1 a U 0 0 0 1 1 1 1 0 1 1 a Ready Dispy Settings N Tres Module 2 Data - Excel mohamed abdulle Fic Home Insert Page Layout Formula Data Review View Tell me what you want to do Share - Calibri - 11-AA == h Wrap Test Gunnal Nume 2 Normal Bad X. Cut t Copy Paste farms Panter Percent 2 Calculation Comma 2 Condhana Tomat Goud Formatting Titlu IV- -A- ===Merge Carter % 3 Neutral Check Cell Emory. Insert Delete comma Sort find Filiu - Sd Clipboard Fant Alq Number Editing 89 A B C F H K M N P R s T u V x 1 2 3 4 5 0 7 8 Gender 1-Male Working 1-Yes Subway/bus or w/ Car =11/C Profit or Not 1= Profit Goverment or Not Government 0-Female DENO U=Subway/ O=Not CENot 10 11 12 13 74 13 16 17 18 19 20 21 24 26 27 28 30 31 23 33 34 35 36 37 Household DataLegend for Household data (+ Ready Display Settings P 100 21 AM 0/17/2221 O


