

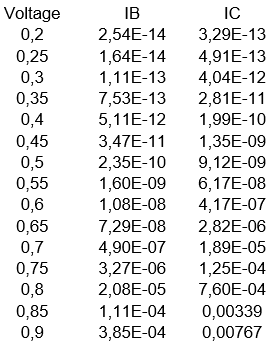
Question: Using the I vs V data shown in the table for a BJT , plot the Gummel curves and find the ideality factor, and finally,
Using the I vs V data shown in the table for a BJTplot the Gummel curves and find the ideality factor, and finally, plot the gain versus IC
Explain physically what happens in each of the graphs Gummel curves, gain as a function of IC and explain how you obtain the ideality factor.
Voltage, IB IC
EE
EE
EE
EE
EE
EE
EE
EE
EE
EE
EE
EE
EE
E
E
Step by Step Solution
There are 3 Steps involved in it
1 Expert Approved Answer
Step: 1 Unlock

Question Has Been Solved by an Expert!
Get step-by-step solutions from verified subject matter experts
Step: 2 Unlock
Step: 3 Unlock