

Question: Using the income statement and balance sheet on next few pages, fill in the table below with 2016 ratios. Round to the nearest tenth. 1.
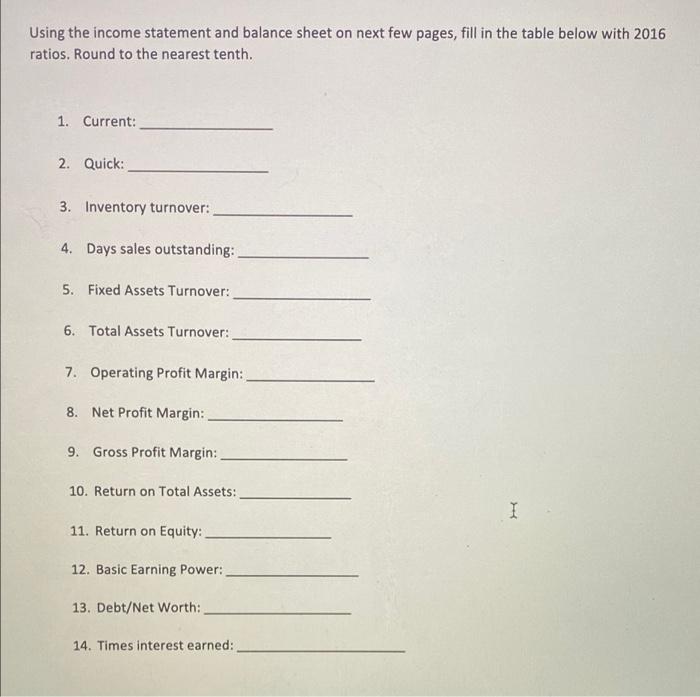
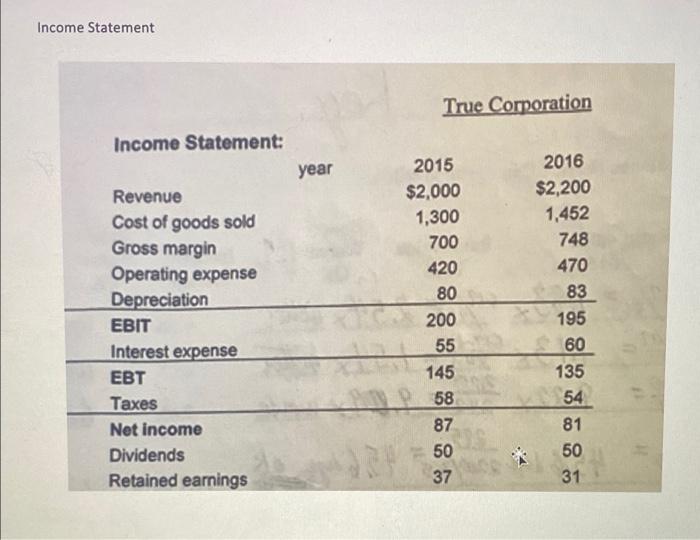
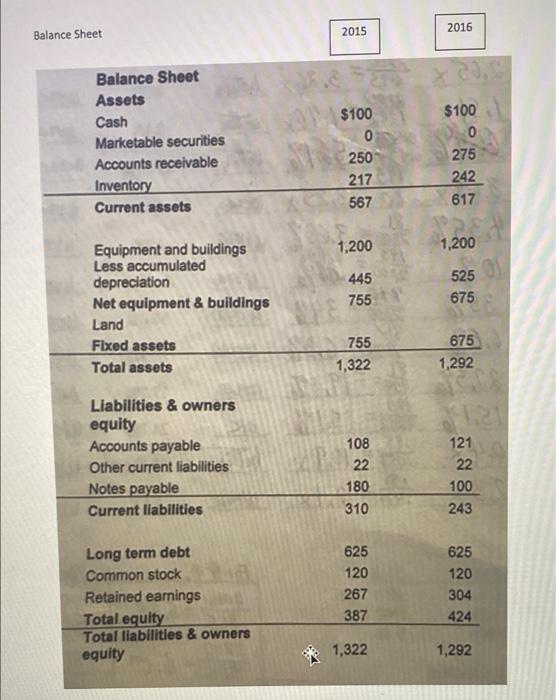
Using the income statement and balance sheet on next few pages, fill in the table below with 2016 ratios. Round to the nearest tenth. 1. Current: 2. Quick: 3. Inventory turnover: 4. Days sales outstanding: 5. Fixed Assets Turnover: 6. Total Assets Turnover: 7. Operating Profit Margin: 8. Net Profit Margin: 9. Gross Profit Margin: 10. Return on Total Assets: I 11. Return on Equity: 12. Basic Earning Power: 13. Debt/Net Worth: 14. Times interest earned: Income Statement True Corporation Income Statement: year Revenue Cost of goods sold Gross margin Operating expense Depreciation EBIT Interest expense EBT Taxes Net Income Dividends Retained earnings 2015 $2,000 1,300 700 420 80 200 55 145 58 87 50 37 2016 $2,200 1,452 748 470 83 195 60 135 54 81 50 31 2015 2016 Balance Sheet Balance Sheet Assets Cash Marketable securities Accounts receivable Inventory Current assets $100 0 250 217 567 $100 0 275 242 617 2007 1,200 1,200 445 755 525 675 Equipment and buildings Less accumulated depreciation Net equipment & buildings Land Fixed assets Total assets 755 1,322 675 1,292 108 Liabilities & owners equity Accounts payable Other current liabilities Notes payable Current liabilities 22 121 22 100 243 180 310 Long term debt Common stock Retained earnings Total equity Total liabilities & owners equity 625 120 267 387 625 120 304 424 1,322 1,292
Step by Step Solution
There are 3 Steps involved in it

Get step-by-step solutions from verified subject matter experts