

Question: Using the industry average table below, analyze and compare the company. Make sure to be specific about your diagnosis and recommendations. This is your opportunity
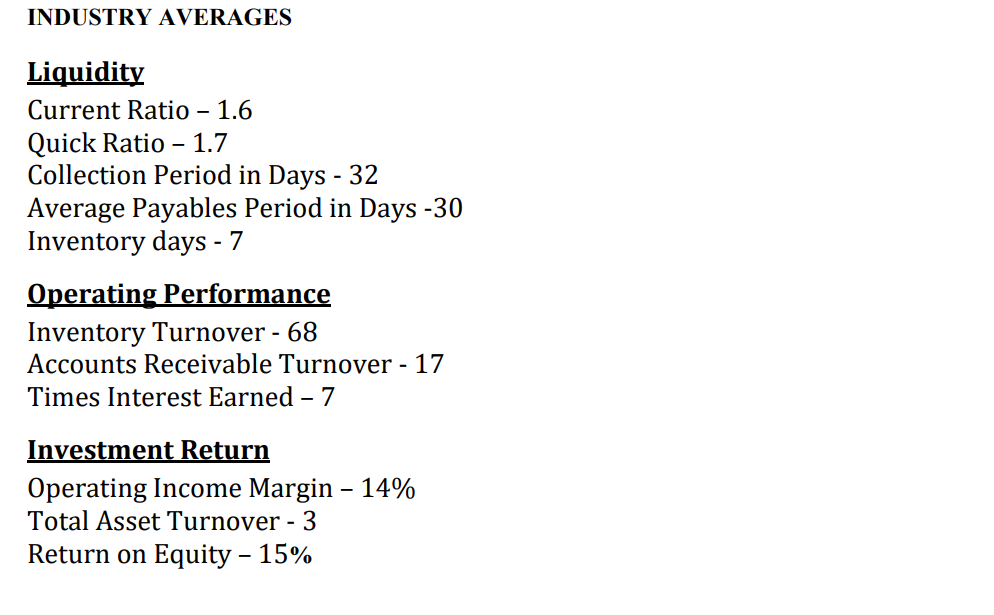
Using the industry average table below, analyze and compare the company. Make sure to be specific about your diagnosis and recommendations. This is your opportunity to show your level of deep analysis and future projections. 1. Compare the company Performance based on the two different years financial reports. 2. Compare the company with the industry average and identify the major problems. 3. Recommend solutions for the problems identified. INDUSTRY AVERAGES Liquidity Current Ratio - 1.6 Quick Ratio - 1.7 Collection Period in Days - 32 Average Payables Period in Days -30 Inventory days - 7 Operating Performance Inventory Turnover - 68 Accounts Receivable Turnover - 17 Times Interest Earned - 7 Investment Return Operating Income Margin - 14\% Total Asset Turnover - 3 Return on Equity - 15\%
Step by Step Solution
There are 3 Steps involved in it

Get step-by-step solutions from verified subject matter experts