

Question: Using the info above, Joe now needs a rough-cut capacity check to determine whether the capacity at each work center is adequate to support the
Using the info above, Joe now needs a rough-cut capacity check to determine whether the capacity at each work center is adequate to support the expected demand. Using the forecasted demand as your proposed master schedule, calculate the load profile for each work center for each week of the second quarter. Highlight any weeks in which problems might occur.
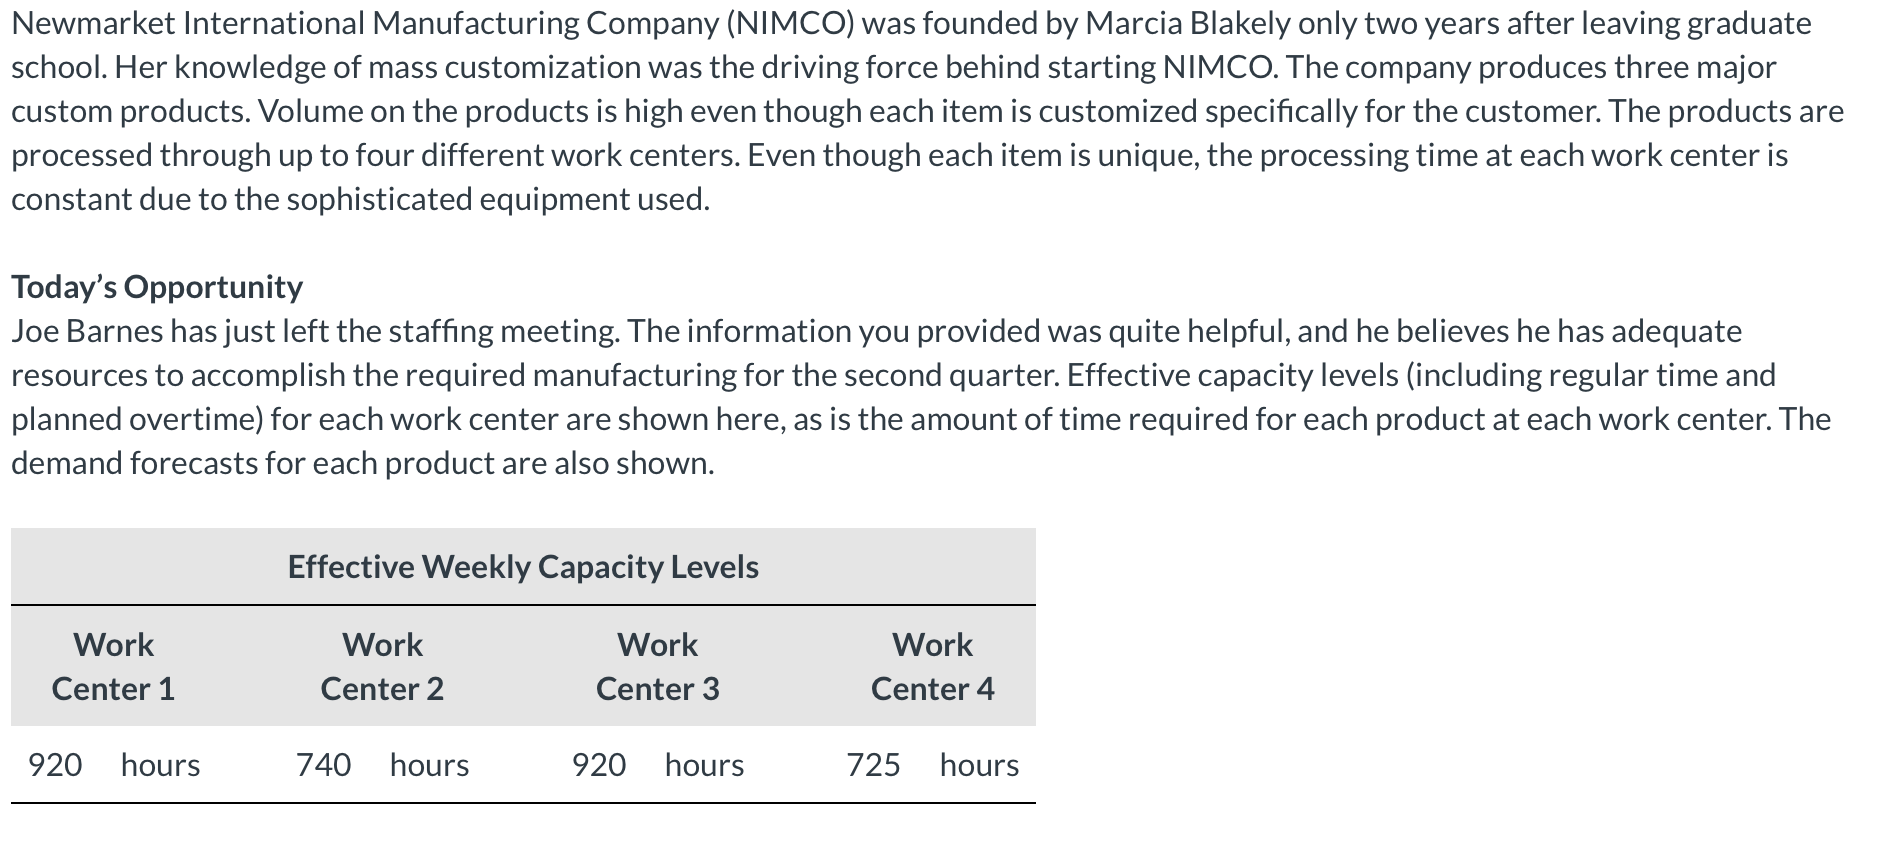
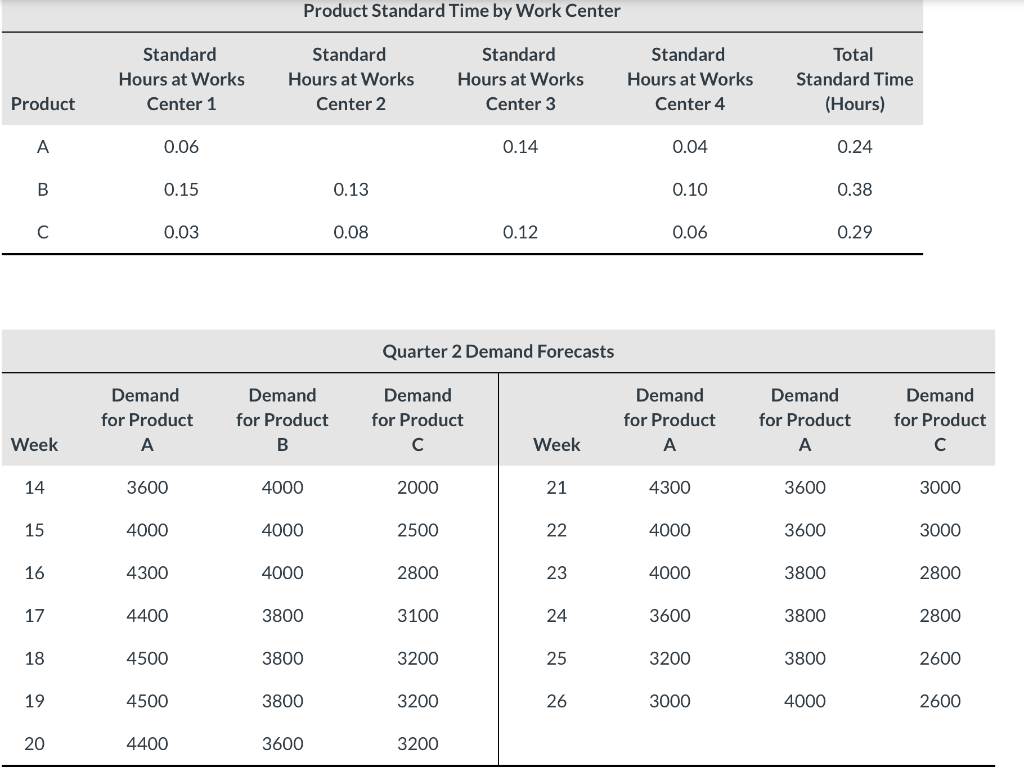
Newmarket International Manufacturing Company (NIMCO) was founded by Marcia Blakely only two years after leaving graduate school. Her knowledge of mass customization was the driving force behind starting NIMCO. The company produces three major custom products. Volume on the products is high even though each item is customized specifically for the customer. The products are processed through up to four different work centers. Even though each item is unique, the processing time at each work center is constant due to the sophisticated equipment used. Today's Opportunity Joe Barnes has just left the staffing meeting. The information you provided was quite helpful, and he believes he has adequate resources to accomplish the required manufacturing for the second quarter. Effective capacity levels (including regular time and planned overtime) for each work center are shown here, as is the amount of time required for each product at each work center. The demand for asts for each product are also shown. Effective Weekly Capacity Levels Work Center 1 Work Center 2 Work Center 3 Work Center 4 920 hours 740 hours 920 hours 725 hours Product Standard Time by Work Center Standard Hours at Works Center 1 Standard Hours at Works Center 2 Standard Hours at Works Center 3 Standard Hours at Works Center 4 Total Standard Time (Hours) Product A 0.06 0.14 0.04 0.24 B 0.15 0.13 0.10 0.38 0.03 0.08 0.12 0.06 0.29 Quarter 2 Demand Forecasts Demand for Product Demand for Product B Demand for Product Demand for Product A Demand for Product Demand for Product Week A Week 14 3600 4000 2000 21 4300 3600 3000 15 4000 4000 2500 22 4000 3600 3000 16 4300 4000 2800 23 4000 3800 2800 17 4400 3800 3100 24 3600 3800 2800 1 18 4500 3800 3200 25 3200 3800 2600 19 4500 3800 3200 26 3000 4000 2600 20 4400 3600 3200Step by Step Solution
There are 3 Steps involved in it
1 Expert Approved Answer
Step: 1 Unlock

Question Has Been Solved by an Expert!
Get step-by-step solutions from verified subject matter experts
Step: 2 Unlock
Step: 3 Unlock