

Question: Using the information from the table below, draw the graph for a function f. Label all intercepts, horizontal and vertical asymptote(s), inflection point(s) for full
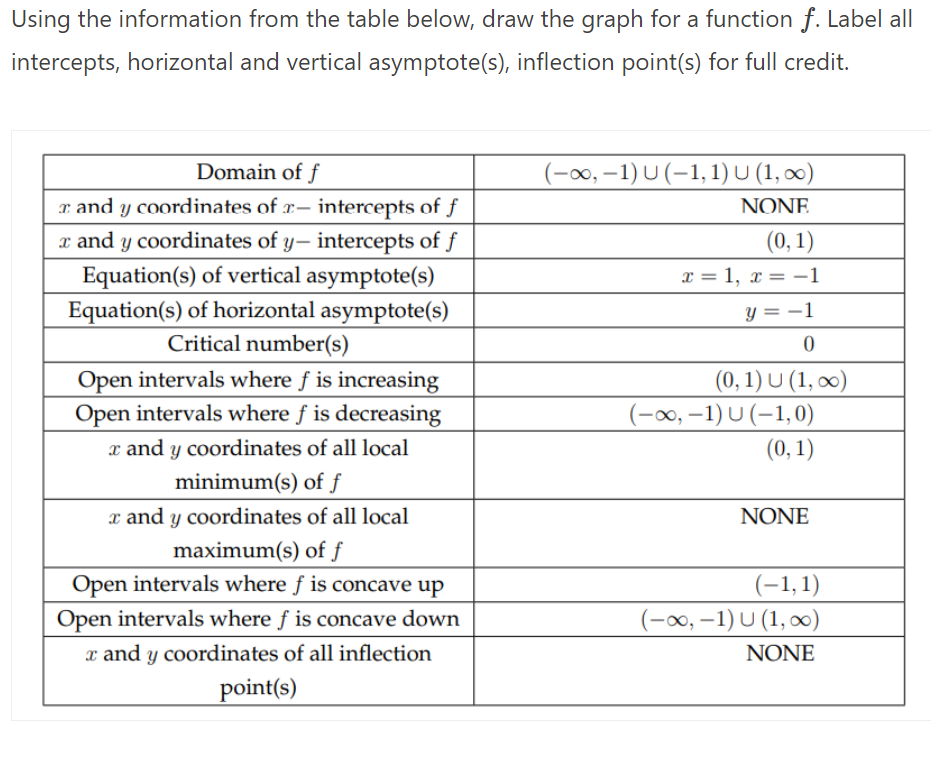

Using the information from the table below, draw the graph for a function f. Label all intercepts, horizontal and vertical asymptote(s), inflection point(s) for full credit. Domain of f (-00, -1) U (-1, 1) U (1, 00) r and y coordinates of r- intercepts of f NONE r and y coordinates of y- intercepts of f (0, 1) Equation(s) of vertical asymptote(s) r=1,r=-1 Equation(s) of horizontal asymptote(s) y = -1 Critical number(s) 0 Open intervals where f is increasing (0, 1) U (1, 00) Open intervals where f is decreasing (-00, -1) U (-1,0) x and y coordinates of all local (0, 1) minimum(s) of f x and y coordinates of all local NONE maximum(s) of f Open intervals where f is concave up (-1, 1) Open intervals where f is concave down (-00, -1) U (1, 00) r and y coordinates of all inflection NONE point(s)
Step by Step Solution
There are 3 Steps involved in it

Get step-by-step solutions from verified subject matter experts