

Question: Using the information given, fill in the charts below to calculate the total cost of goods sold and total ending inventory amounts for a Company
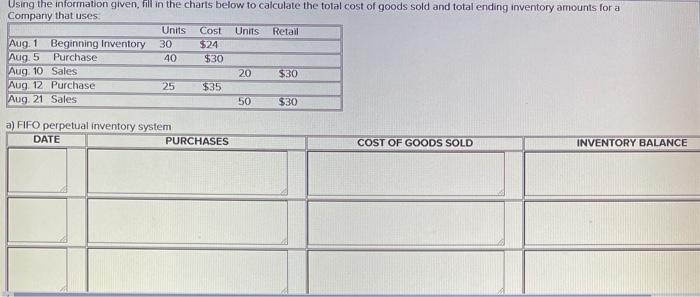
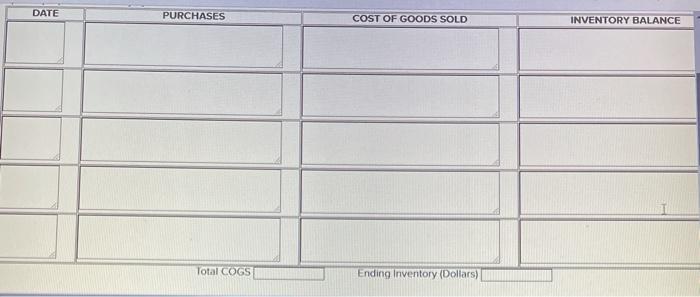
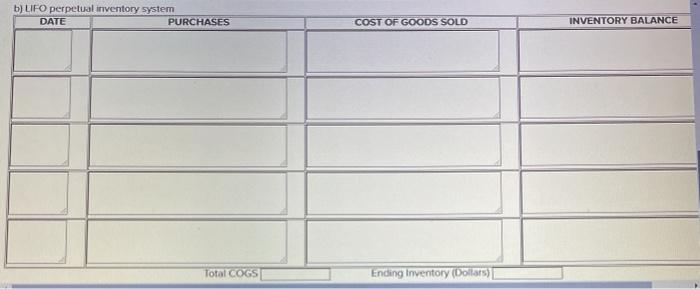
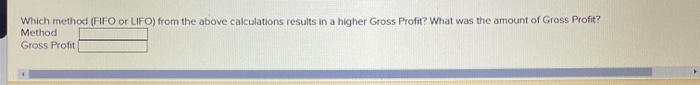
Using the information given, fill in the charts below to calculate the total cost of goods sold and total ending inventory amounts for a Company that uses: Units Cost Units Retail Aug. 1 Beginning Inventory 30 $24 Aug. 5 Purchase 40 $30 Aug 10 Sales 20 $30 Aug 12 Purchase 25 $35 Aug. 21 Sales 50 $30 a) FIFO perpetual inventory system DATE PURCHASES COST OF GOODS SOLD INVENTORY BALANCE DATE PURCHASES COST OF GOODS SOLD INVENTORY BALANCE Total COGS Ending Inventory (Dollars) b) LIFO perpetual inventory system DATE PURCHASES COST OF GOODS SOLD INVENTORY BALANCE Total COGS Ending Inventory (Dollars) Which method (FIFO or LIFO) from the above calculations results in a higher Gross Profit? What was the amount of Gross Profit? Method Gross Profit
Step by Step Solution
There are 3 Steps involved in it

Get step-by-step solutions from verified subject matter experts