

Question: Using the information in the statements below, what is Net Cash Flow from Investing Activities for Genoda Inc. in Year 4? 2: Genoda, Inc. Balance
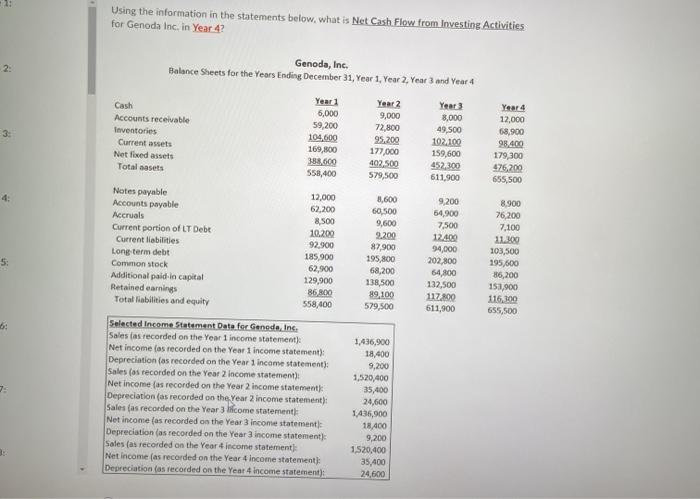
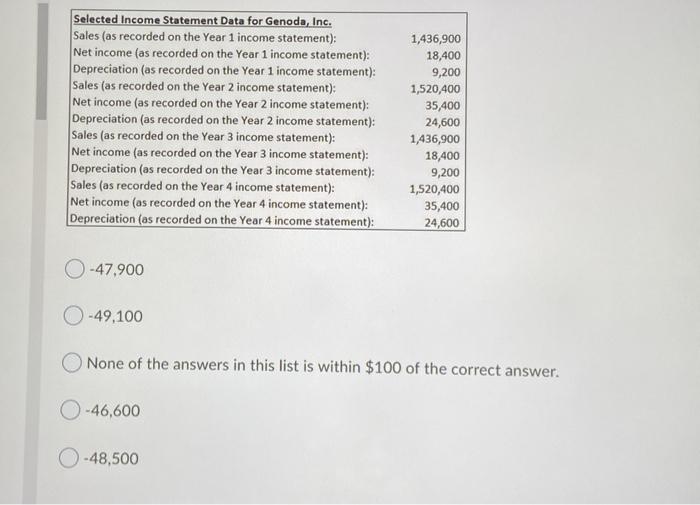
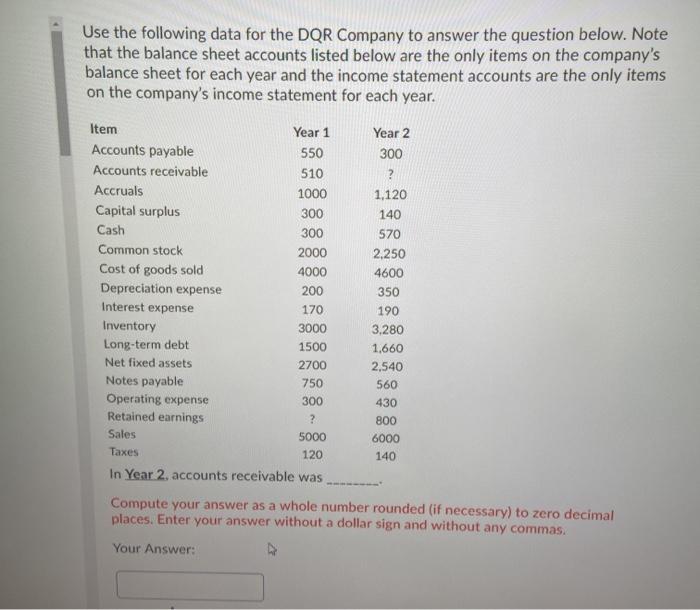
Using the information in the statements below, what is Net Cash Flow from Investing Activities for Genoda Inc. in Year 4? 2: Genoda, Inc. Balance Sheets for the Years Ending December 31, Year 1 Year 2, Year 3 and Year 4 Year1 Year 2 Year 3 Cash 6,000 9,000 8,000 Accounts receivable 59,200 72,800 49,500 Inventories 104,600 Current assets 95,200 102.100 169,800 177,000 Net fixed assets 159,600 388,600 Total asets 402.500 452,300 558,400 579,500 611,900 Notes payable 12,000 9,200 Accounts payable 62,200 60,500 Accruals 64,900 9,600 7,500 Current portion of LT Debt 10.200 9.200 12.400 Current liabilities 92.900 87.900 94,000 Long term debt 185.900 195,800 202,800 Common stock 62,900 68,200 64.800 Additional paid in capital 129,900 138,500 132,500 Retained earnings 86,800 89,100 117.800 Total liabilities and equity 558,400 579,500 611,900 Year 4 12,000 68,900 98.400 179,300 476200 655,500 4 2,600 8.500 S: 8.900 76,200 7,100 11.300 103,500 195,600 36,200 151,900 116,300 655,500 7 Selected Income Statement Data for Genede Inc. Sales as recorded on the Year 1 income statement Net income as recorded on the Year 1 income statement): Depreciation (as recorded on the Year 1 income statement): Sales (as recorded on the Year 2 income statement): Net Income (as recorded on the Year 2 income statement Depreciation (as recorded on the Year 2 income statement): Sales (as recorded on the Year 3 lcome statement Net income (as recorded on the Year 3 income statement Depreciation (as recorded on the Year 3 income statement Sales (as recorded on the Year 4 income statement Net Income (as recorded on the Year 4 Income statement): Depreciation (as recorded on the Year 4 income statement) 1,436,900 18,400 9,200 1,520,400 35,400 24,600 1,436,900 18.400 9,200 1,520,400 35,400 24,600 Selected Income Statement Data for Genoda, Inc. Sales (as recorded on the Year 1 income statement): Net income (as recorded on the Year 1 income statement): Depreciation (as recorded on the Year 1 income statement): Sales (as recorded on the Year 2 income statement): Net income (as recorded on the Year 2 income statement): Depreciation (as recorded on the Year 2 income statement): Sales (as recorded on the Year 3 income statement): Net income (as recorded on the Year 3 income statement): Depreciation (as recorded on the Year 3 income statement): Sales (as recorded on the Year 4 income statement): Net income (as recorded on the Year 4 income statement): Depreciation (as recorded on the Year 4 income statement): 1,436,900 18,400 9,200 1,520,400 35,400 24,600 1,436,900 18,400 9,200 1,520,400 35,400 24,600 -47,900 O-49,100 None of the answers in this list is within $100 of the correct answer. - 46,600 O-48,500 Use the following data for the DQR Company to answer the question below. Note that the balance sheet accounts listed below are the only items on the company's balance sheet for each year and the income statement accounts are the only items on the company's income statement for each year. Item Year 1 Year 2 Accounts payable 550 300 Accounts receivable 510 ? Accruals 1000 1.120 Capital surplus 300 140 Cash 300 570 Common stock 2000 2.250 Cost of goods sold 4000 4600 Depreciation expense 200 350 Interest expense 170 190 Inventory 3000 3,280 Long-term debt 1500 1.660 Net fixed assets 2700 2,540 Notes payable 750 560 Operating expense 300 430 Retained earnings 800 Sales 5000 6000 Taxes 120 140 In Year 2. accounts receivable was Compute your answer as a whole number rounded (if necessary) to zero decimal places. Enter your answer without a dollar sign and without any commas. Your
Step by Step Solution
There are 3 Steps involved in it

Get step-by-step solutions from verified subject matter experts