

Question: Using the information on the table and in he graphs below: Date 1 Mo 2 Mo 3 Mo 4 Mo 6 Mo 1 Yr 2
Using the information on the table and in he graphs below:
| Date | 1 Mo | 2 Mo | 3 Mo | 4 Mo | 6 Mo | 1 Yr | 2 Yr | 3 Yr | 5 Yr | 7 Yr | 10 Yr | 20 Yr | 30 Yr |
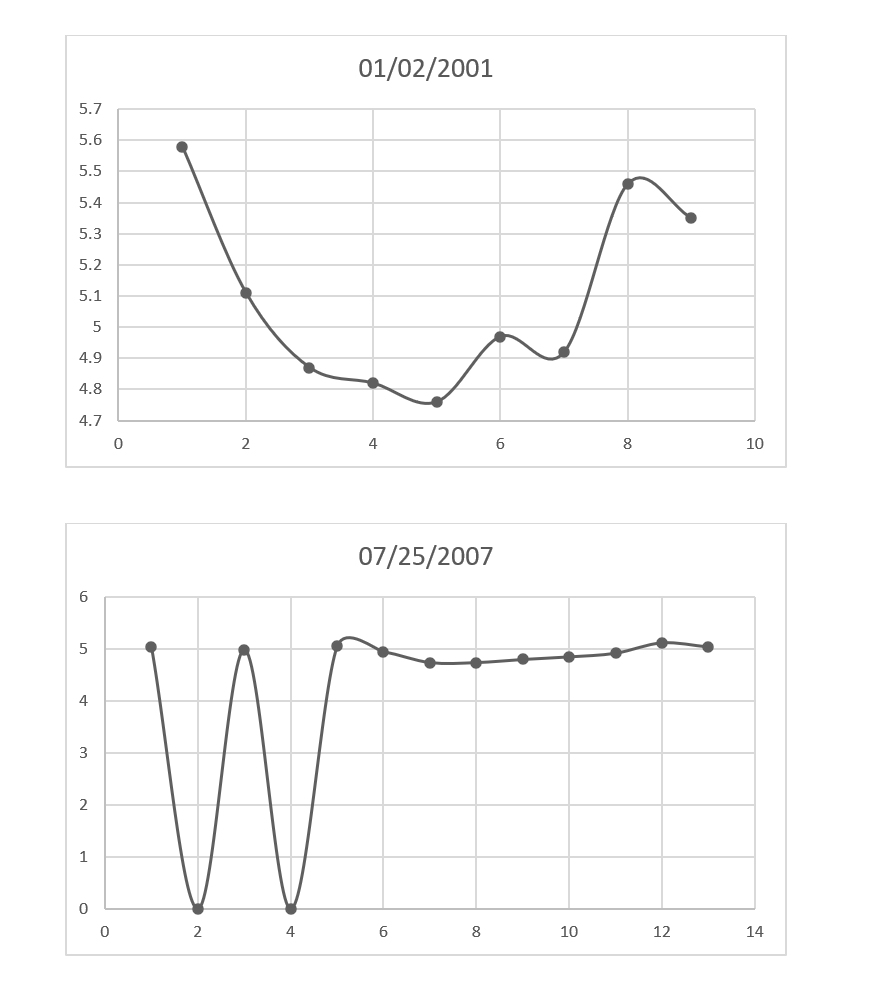
| 01/02/2001 | N/A | N/A | 5.87 | N/A | 5.58 | 5.11 | 4.87 | 4.82 | 4.76 | 4.97 | 4.92 | 5.46 | 5.35 |
| 07/25/2007 | 5.04 | N/A | 4.99 | N/A | 5.05 | 4.95 | 4.74 | 4.74 | 4.8 | 4.85 | 4.92 | 5.12 | 5.04 |
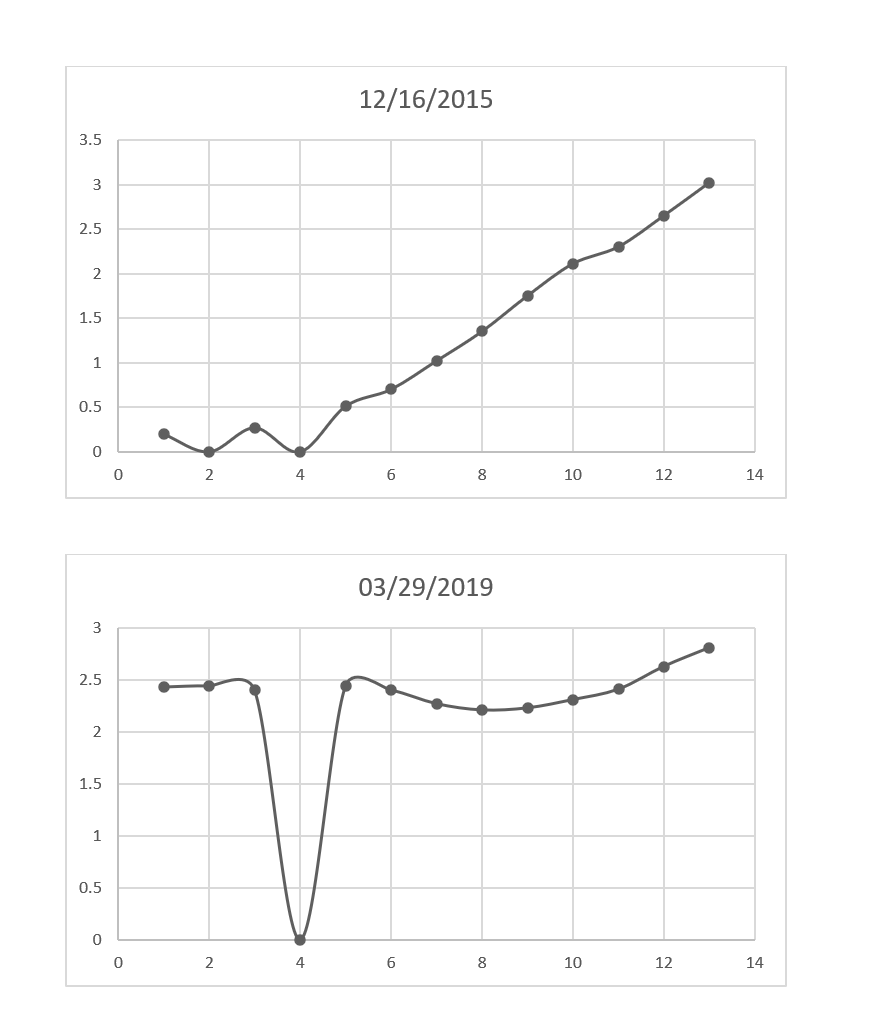
| 12/16/2015 | 0.2 | N/A | 0.27 | N/A | 0.51 | 0.7 | 1.02 | 1.35 | 1.75 | 2.11 | 2.3 | 2.65 | 3.02 |
| 03/29/2019 | 2.43 | 2.44 | 2.4 | N/A | 2.44 | 2.4 | 2.27 | 2.21 | 2.23 | 2.31 | 2.41 | 2.63 | 2.81 |
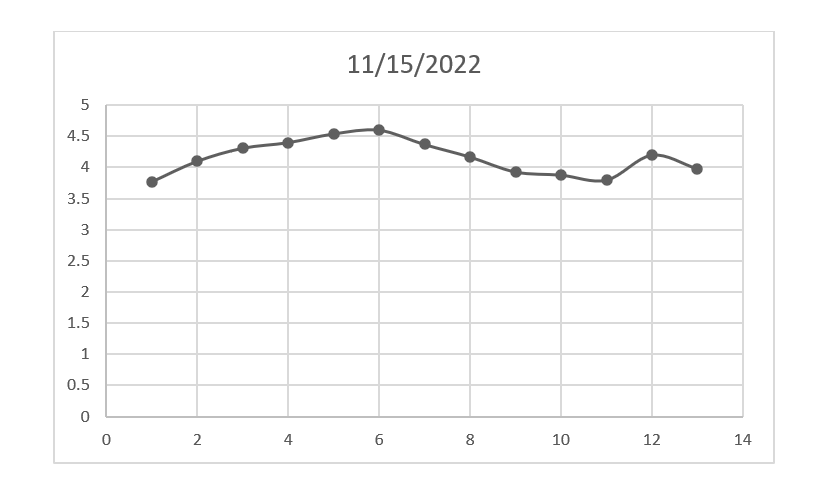
| 11/15/2022 | 3.77 | 4.1 | 4.31 | 4.4 | 4.54 | 4.6 | 4.37 | 4.17 | 3.93 | 3.88 | 3.8 | 4.2 | 3.98 |
01/02/2001 5.7 5.6 5.5 5.4 5.3 5.2 5.1 5 4.9 4.8 4.7 0 2 4 6 8 10 07/25/2007 6 5 4 3 2 4 6 8 10 12 1412/16/2015 3.5 3 2.5 2 1.5 1 0.5 2 4 8 10 12 14 03/29/2019 3 2.5 2 1.5 1 0.5 2 4 6 8 10 12 14
Step by Step Solution
There are 3 Steps involved in it
1 Expert Approved Answer
Step: 1 Unlock

Question Has Been Solved by an Expert!
Get step-by-step solutions from verified subject matter experts
Step: 2 Unlock
Step: 3 Unlock