

Question: Using the information provided an the graph, complete the following table with the changes in capital and labor moving from paint L to K and
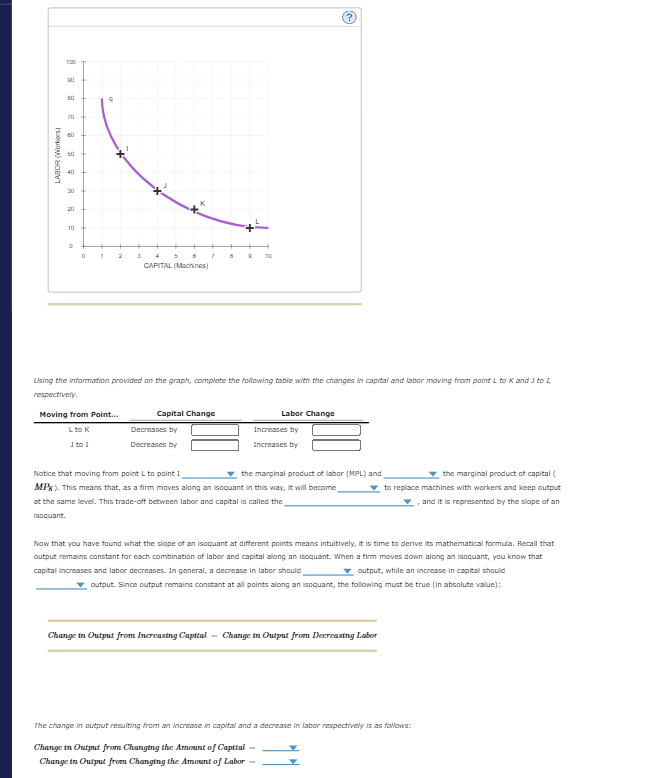
Using the information provided an the graph, complete the following table with the changes in capital and labor moving from paint L to K and I to I,
respectively.
Notice that moving from point L to point the marginal product of labor MPL and the marginal product of capital
MPK This means that, as a firm moves along an isoquant in this way, it will become to replace machines with workers and loeep output
at the same level. This tradeoff between labor and capital is called the
and it is represented by the slope of an
isoquant.
Now that you have found what the slope of an isoquant at different points means intuitively, it is time to derive its mathematical formula. Recail that
output remains constant for each combination of labor and capital along an isoquant. When a firm moves down along an isoquant, you know that
capital increases and labor decreases. In general, a decrease in labor shoulc
output, while an increase in capital should
output. Since output remains constant at all points along an lsoquant, the following must be true in absolute value:
Change in Output from Increasing Capttal Change in Output from Decreasing Labor
The change in output resulting from an increase in capltal and a decrease in labor respectively is as follows:
Change in Output from Changing the Amount of Capital
Change in Output from Changing the Amount of Labor
PLS EXPLAIN EVERYTHING STEP BY STEP
THIS IS FROM ECO
Step by Step Solution
There are 3 Steps involved in it
1 Expert Approved Answer
Step: 1 Unlock

Question Has Been Solved by an Expert!
Get step-by-step solutions from verified subject matter experts
Step: 2 Unlock
Step: 3 Unlock