Question: Using the information provided, I don't know how to get the Jan Feb BS recalculation, 2021 budgets, and variance. Note that the last three pages
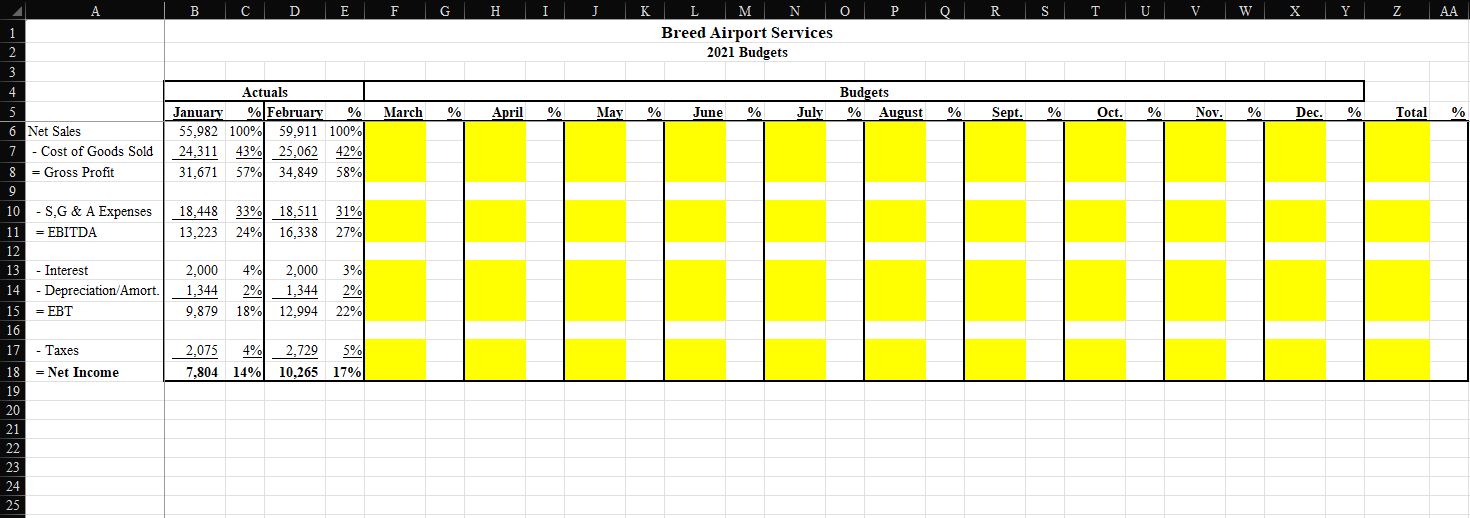
Using the information provided, I don't know how to get the Jan Feb BS recalculation, 2021 budgets, and variance. Note that the last three pages and information are in yellow cells.
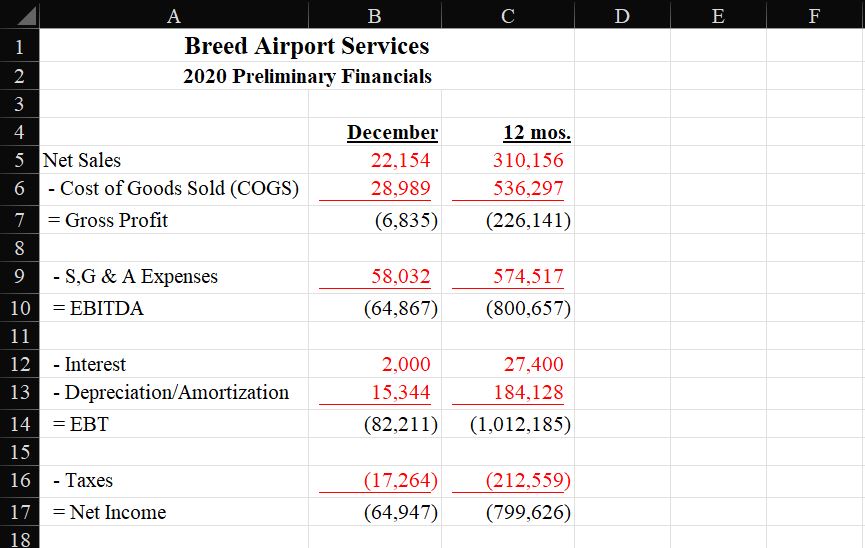
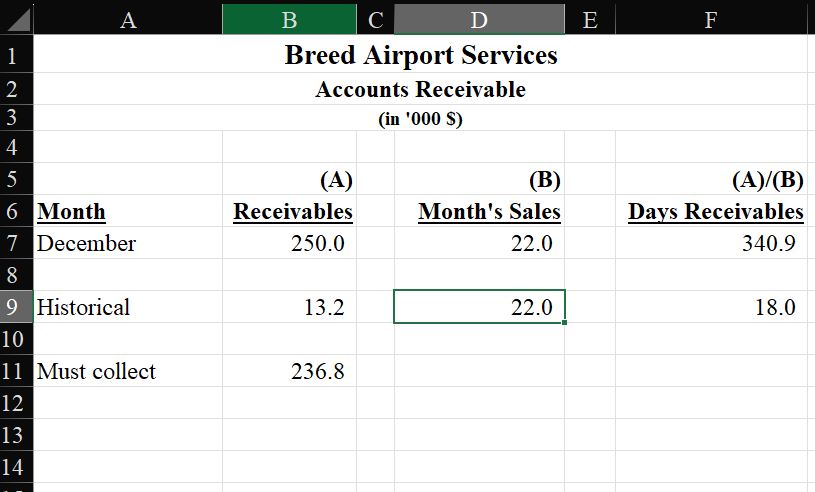
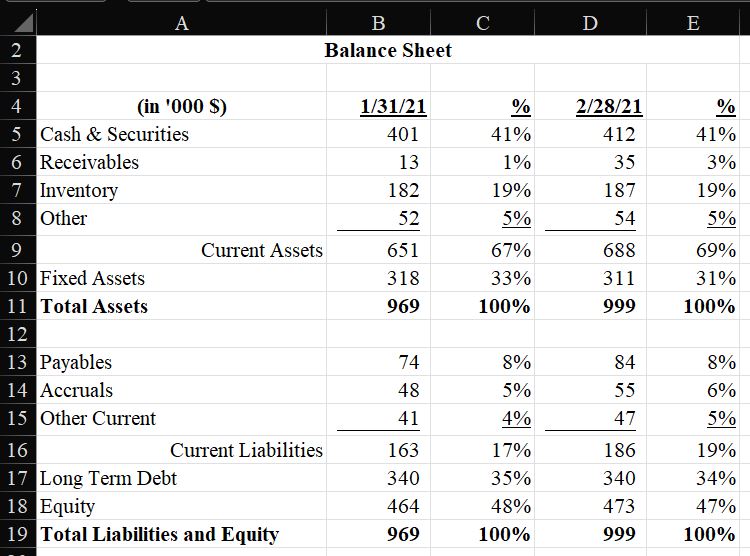
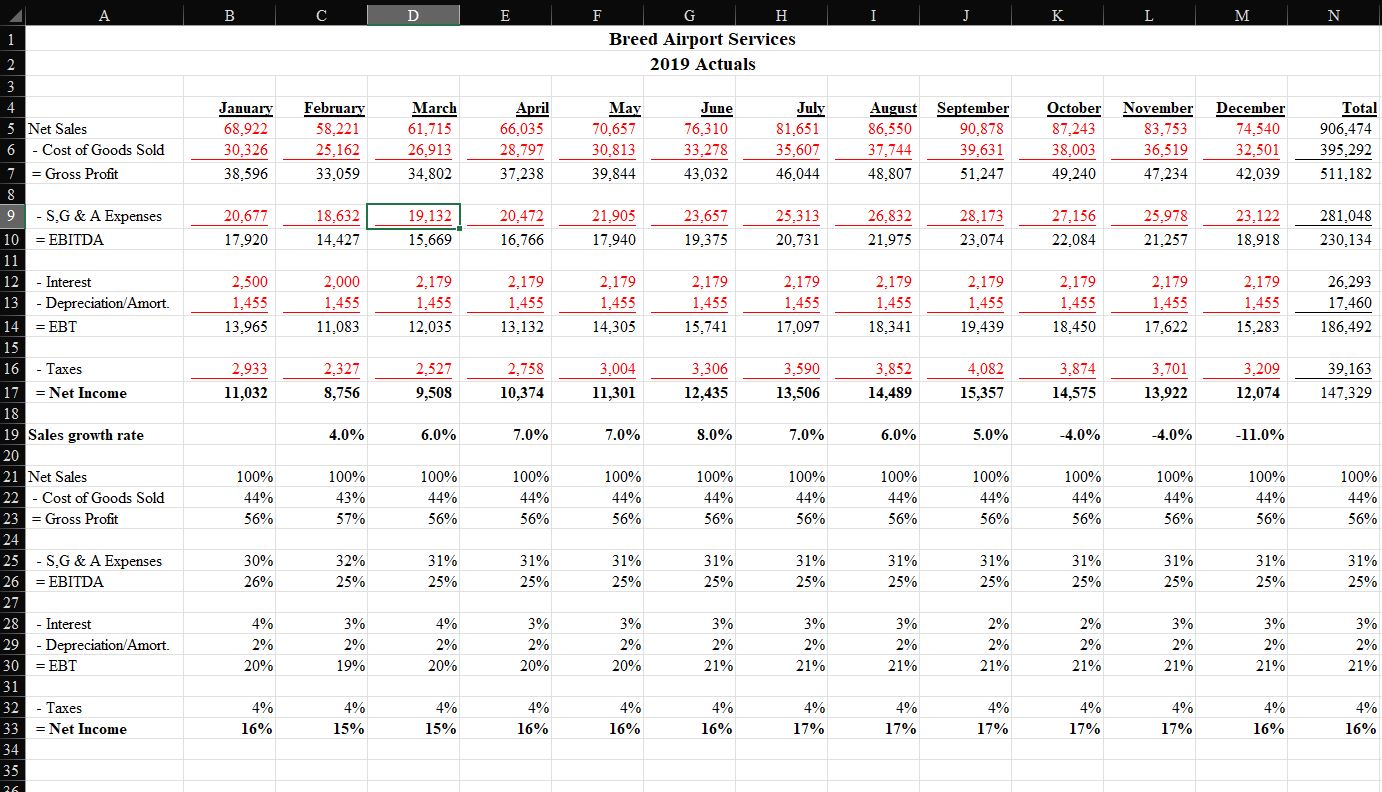
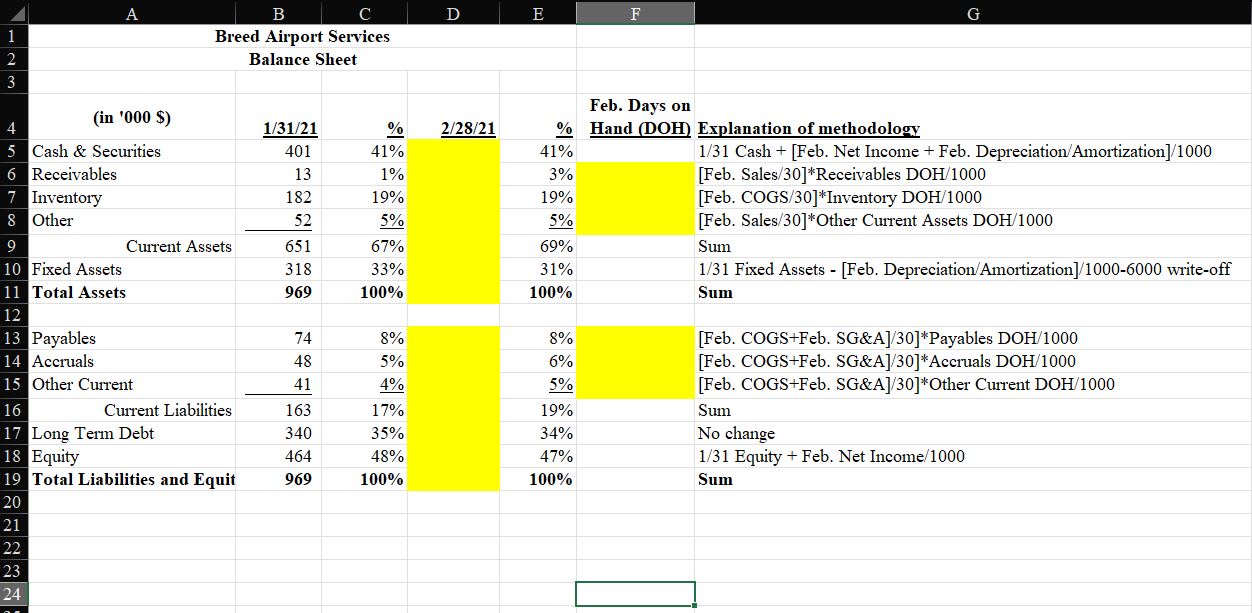
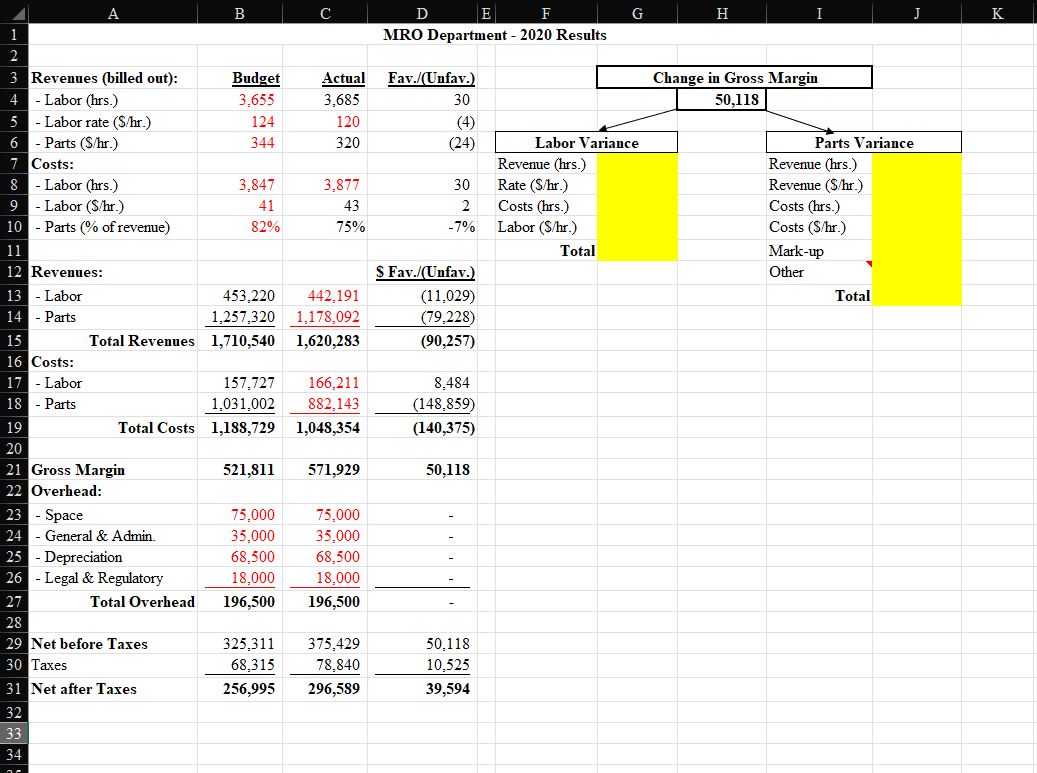
A B C D E F Breed Airport Services 2 2020 Preliminary Financials 3 4 December 12 mos. 5 Net Sales 22,154 310,156 6 - Cost of Goods Sold (COGS) 28,989 536,297 7 = Gross Profit (6,835) (226,141) 8 9 - S,G & A Expenses 58,032 574,517 10 = EBITDA (64,867) (800,657) 11 12 - Interest 2,000 27,400 13 - Depreciation/Amortization 15.344 184,128 14 = EBT (82,211) (1,012,185) 15 16 - Taxes (17,264) (212,559) 17 = Net Income (64,947) (799,626) 18\f= (L D | e A Month December Historical Must collect Breed Airport Services Accounts Receivable (in '000 S) (A) (B) (A)/(B) Receivables Month's Sales Days Receivables 250.0 JZH 340.9 132 220 18.0 236.8 \fA B C D E 2 Balance Sheet 3 4 (in '000 $) 1/31/21 % 2/28/21 % 5 Cash & Securities 401 41% 412 41% 6 Receivables 13 1% 35 3% 7 Inventory 182 19% 187 19% 8 Other 52 5% 54 5% 9 Current Assets 651 67% 688 69% 10 Fixed Assets 318 33% 311 31% 11 Total Assets 969 100% 999 100% 12 Payables 74 8% 84 8% 14 Accruals 48 5% 55 6% 15 Other Current 41 4% 47 5% 16 Current Liabilities 163 17% 186 19% 17 Long Term Debt 340 35% 340 34% 18 Equity 464 48% 473 47% 19 Total Liabilities and Equity 969 100% 999 100%B C D E F G H K M N Breed Airport Services 2019 Actuals A UN January February March April May June July August September October November December Total 5 Net Sales 68,922 58,221 61,715 66.035 70,657 76,310 81,651 86.550 90,878 87,243 83,753 74,540 906,474 6 - Cost of Goods Sold 30,326 25,162 26,913 28,797 30,813 33,278 35,607 37,744 39.631 38,003 36,519 32,501 395,292 = Gross Profit 38.596 33.059 34.802 37.238 39.844 43.032 46.044 48.807 51.247 49.240 47.234 42.039 511,182 8 9 S,G & A Expenses 20,677 18,632 19,132 20,472 21,905 23,657 25,313 26,832 28,173 27,156 25,978 23,122 281,048 10 = EBITDA 17,920 14.427 15.669 16.766 17.940 19,375 20,731 21,975 23.074 22.084 21.257 18,918 230,134 12 - Interest 2,500 2,000 2,179 2,179 2,179 2,179 2,179 2,179 2.179 2,179 2,179 2,179 26,293 13 - Depreciation/Amort. 1,455 1,455 1.455 1,455 1,455 1.455 1,455 1,455 1.455 1,455 1,455 1,455 17,460 14 = EBT 13,965 11,083 12.035 13.132 14,305 15,741 17,097 18,341 19,439 18,450 17,622 15,283 186,492 15 16 - Taxes 2.933 2,327 2,527 2,758 3,004 3.306 3.590 3,852 4.082 3,874 3,701 3,209 39,163 17 =Net Income 11,032 8, 756 9,508 10.374 11,301 12,435 13.506 14,489 15,357 14,575 13,922 12,074 147,329 18 19 Sales growth rate 4.0% 6.0% 7.0% 7.0% 8.0% 7.0% 6.0% 5.0% -4.0% -4.0% -11.0% 20 21 Net Sales 100% 100% 100% 100% 100% 100% 100% 100% 100% 100% 100% 100% 100% 22 - Cost of Goods Sold 44% 13% 14% 44% 44% 44% 44% 44% 44% 44% 44% 44% 14% 23 = Gross Profit 56% 57% 56% 56% 56% 56% 56% 56% 56% 56% 56% 56% 56% 24 25 S,G & A Expenses 30% 32% 31% 31% 31% 31% 31% 31% 31% 31% 31% 31% 31% 26 = EBITDA 26% 25% 25% 25% 25% 25% 25% 25% 25% 25% 25% 25% 25% 27 28 - Interest 4% 3% 4% 3% 3% 3% 3% 3% 2% 2% 3% 3% 3% 29 - Depreciation/Amort. 2% 2% 2% 2% 2% 2% 2% 2% 2% 2% 2% 2% 2% 30 = EBT 20% 19% 20% 20% 20% 21% 21% 21% 21% 21% 21% 21% 21% 31 32 - Taxes 4% 4% 4% 4% 4% 4% 4% 4% 4% 4% 4% 4% 4% 33 =Net Income 16% 15% 15% 16% 16% 16% 17% 17% 17% 17% 17% 16% 16% 34 35A B C D E F G Breed Airport Services Balance Sheet Feb. Days on (in '000 $) 1/31/21 % 2/28/21 % Hand (DOH) Explanation of methodology 5 Cash & Securities 401 41% 41% 1/31 Cash + [Feb. Net Income + Feb. Depreciation/Amortization]/1000 6 Receivables 13 1% 3% [Feb. Sales/30]*Receivables DOH/1000 7 Inventory 182 19% 19% [Feb. COGS/30]*Inventory DOH/1000 8 Other 52 5% 5% [Feb. Sales/30]*Other Current Assets DOH/1000 9 Current Assets 551 67% 69% Sum 10 Fixed Assets 318 33% 31% 1/31 Fixed Assets - [Feb. Depreciation/Amortization]/1000-6000 write-off 11 Total Assets 969 100% 100% Sum 12 13 Payables 74 8% 8% [Feb. COGS+Feb. SG&A]/30]*Payables DOH/1000 14 Accruals 48 5% 6% [Feb. COGS+Feb. SG&A]/30]*Accruals DOH/1000 15 Other Current 41 4% 5% [Feb. COGS+Feb. SG&A]/30]*Other Current DOH/1000 16 Current Liabilities 163 17% 19% Sum 17 Long Term Debt 340 35% 34% No change 18 Equity 464 48% 47% 1/31 Equity + Feb. Net Income/1000 19 Total Liabilities and Equit 969 100% 100% Sum 20 21 22 23 24\fS N ] L -1 O Revenues (billed out): Labor (hrs)) - Labor rate (S/hr) - Parts (3/hr.) Costs: - Labor (hrs.) - Labor (Sthr) - Parts (% of revenue) Revenues: - Labor _ Parts Total Revenues Costs: - Labor _ Parts Total Costs Gross Margin Overhead: - Space - General & Admin. Depreciation Legal & Regulatory Total Overhead Net before Taxes Taxes Net after Taxes MRO Department - 2020 Results Budget Actual Fav./(Unfav. 3.655 3.685 30 124 120 4 344 320 (24) 3,847 3.877 30 41 43 2 82% 75% -7% $ Fav./(Unfav. 453220 442191 (11,029) 1257320 1178092 (79.228) 1,710,540 1,620,283 (90,257) 157,727 166211 8,484 1,031,002 882143 (148.859) 1,188,729 1.048.354 (140,375) 521,811 571,929 50,118 75.000 75,000 = 35,000 35.000 c 68500 68,500 B 18,000 18,000 B 196,500 196.500 - 325311 375429 50,118 68.315 78.840 10,525 256,995 296,589 39,594 Change in Gross Margin Labor Variance Revenue (hrs.) Rate (5/hr.) Costs (hrs.) Labor (S/hr.) Total Parts Variance Revenue (hrs.) Revenue (S'hr) Costs (hrs.) Costs (5/hr.) Mark-up Other Total
Step by Step Solution
There are 3 Steps involved in it
1 Expert Approved Answer
Step: 1 Unlock
Question Has Been Solved by an Expert!
Get step-by-step solutions from verified subject matter experts
Step: 2 Unlock
Step: 3 Unlock
Students Have Also Explored These Related Accounting Questions!