

Question: Using the information provided in the picture below, calculate the population per franchise for each existing and proposed MLS market. You should consider the population
Using the information provided in the picture below, calculate the population per franchise for each existing and proposed MLS market. You should consider the population data for each market, as well as the number of major-league franchises provided in the data set.
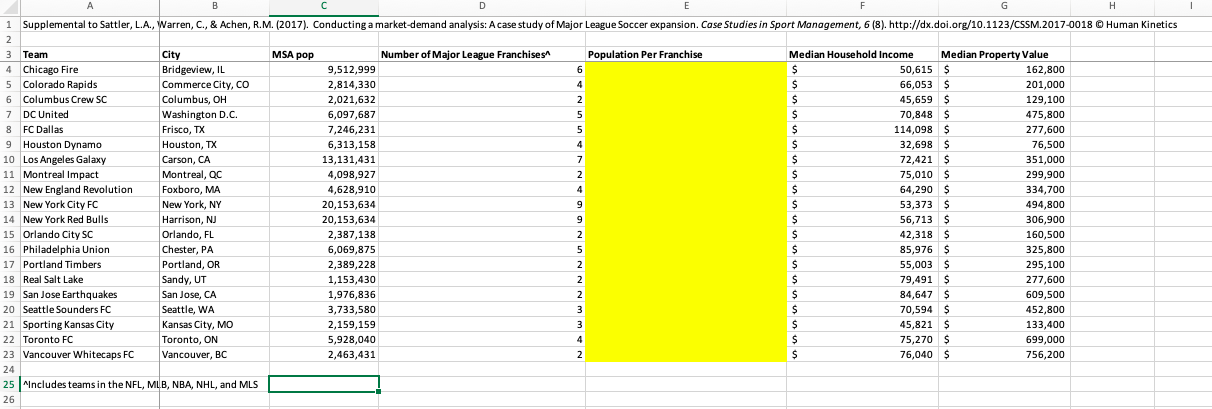
1 Supplemental to Sattler, L.A., Warren, C., & Achen, R.M. (2017). Conducting a market demand analysis: A case study of Major League Soccer expansion. Case Studies in Sport Management, 6(8). http://dx.doi.org/10.1123/CSSM.2017-0018 Human Kinetics MSA pop Population Per Franchise 3 Team City 4 Chicago Fire Bridgeview, IL 5 Colorado Rapids Commerce City, CO 6 Columbus Crew SC Columbus, OH 7 DC United Washington D.C. 8 FC Dallas Frisco, TX 9 Houston Dynamo Houston, TX 10 Los Angeles Galaxy Carson, CA 11 Montreal Impact Montreal, QC 12 New England Revolution Foxboro, MA 13 New York City FC New York, NY 14 New York Red Bulls Harrison, NJ 15 Orlando City SC Orlando, FL 16 Philadelphia Union Chester, PA 17 Portland Timbers Portland, OR 18 Real Salt Lake Sandy, UT 19 San Jose Earthquakes San Jose, CA 20 Seattle Sounders FC Seattle, WA 21 Sporting Kansas City Kansas City, MO 22 Toronto FC Toronto, ON 23 Vancouver Whitecaps FC Vancouver, BC 24 25 Nncludes teams in the NFL, MLB, NBA, NHL, and MLS Number of Major League Franchises 9,512,999 2,814,330 2,021,632 6,097,687 7,246,231 6,313,158 13,131,431 4,098,927 4,628,910 20,153,634 20,153,634 2,387,138 6,069,875 2,389,228 1,153,430 1,976,836 3,733,580 2,159,159 5,928,040 2,463,431 Median Household Income Median Property Value 50,615 $ 162,800 66,053 $ 201,000 45,659 $ 129, 100 70,848 $ 475,800 114,098 $ 277,600 32,698 $ 76,500 72,421 $ 351,000 75,010 $ 299,900 64,290 $ 334,700 53,373 $ 494,800 56,713 $ 306,900 42,318 $ 160,500 85,976 $ 325,800 55,003 $ 295,100 79,491 $ 277,600 84,647 $ 609,500 70,594 $ 452,800 45,821 $ 133,400 75,270 $ 699,000 76,040 $ 756,200 26 1 Supplemental to Sattler, L.A., Warren, C., & Achen, R.M. (2017). Conducting a market demand analysis: A case study of Major League Soccer expansion. Case Studies in Sport Management, 6(8). http://dx.doi.org/10.1123/CSSM.2017-0018 Human Kinetics MSA pop Population Per Franchise 3 Team City 4 Chicago Fire Bridgeview, IL 5 Colorado Rapids Commerce City, CO 6 Columbus Crew SC Columbus, OH 7 DC United Washington D.C. 8 FC Dallas Frisco, TX 9 Houston Dynamo Houston, TX 10 Los Angeles Galaxy Carson, CA 11 Montreal Impact Montreal, QC 12 New England Revolution Foxboro, MA 13 New York City FC New York, NY 14 New York Red Bulls Harrison, NJ 15 Orlando City SC Orlando, FL 16 Philadelphia Union Chester, PA 17 Portland Timbers Portland, OR 18 Real Salt Lake Sandy, UT 19 San Jose Earthquakes San Jose, CA 20 Seattle Sounders FC Seattle, WA 21 Sporting Kansas City Kansas City, MO 22 Toronto FC Toronto, ON 23 Vancouver Whitecaps FC Vancouver, BC 24 25 Nncludes teams in the NFL, MLB, NBA, NHL, and MLS Number of Major League Franchises 9,512,999 2,814,330 2,021,632 6,097,687 7,246,231 6,313,158 13,131,431 4,098,927 4,628,910 20,153,634 20,153,634 2,387,138 6,069,875 2,389,228 1,153,430 1,976,836 3,733,580 2,159,159 5,928,040 2,463,431 Median Household Income Median Property Value 50,615 $ 162,800 66,053 $ 201,000 45,659 $ 129, 100 70,848 $ 475,800 114,098 $ 277,600 32,698 $ 76,500 72,421 $ 351,000 75,010 $ 299,900 64,290 $ 334,700 53,373 $ 494,800 56,713 $ 306,900 42,318 $ 160,500 85,976 $ 325,800 55,003 $ 295,100 79,491 $ 277,600 84,647 $ 609,500 70,594 $ 452,800 45,821 $ 133,400 75,270 $ 699,000 76,040 $ 756,200 26
Step by Step Solution
There are 3 Steps involved in it

Get step-by-step solutions from verified subject matter experts