

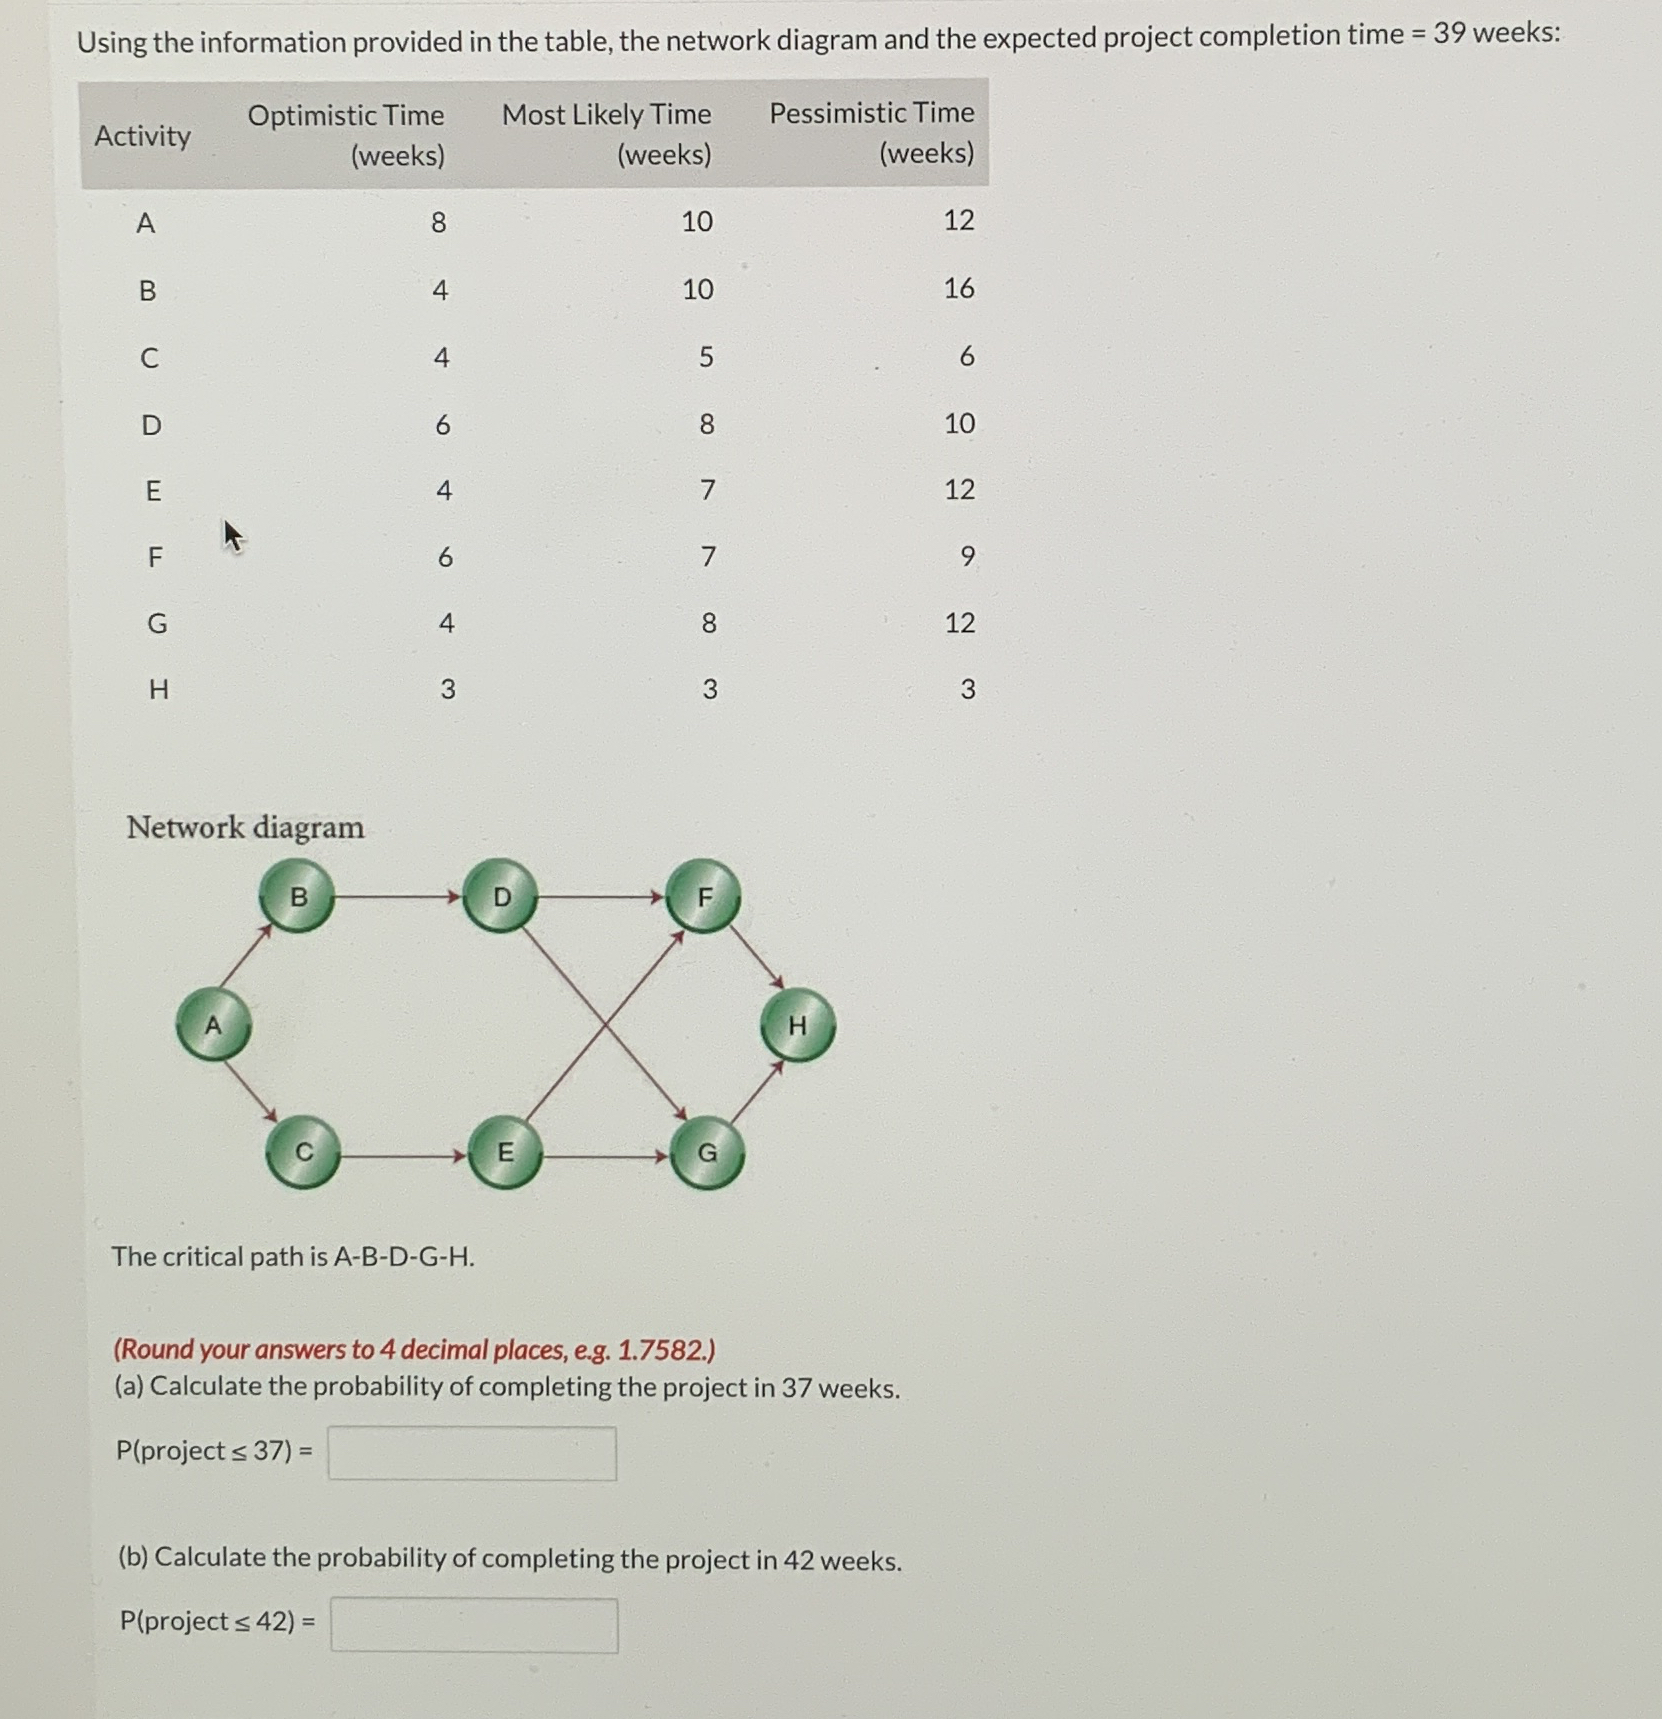
Question: Using the information provided in the table, the network diagram and the expected project completion time = 3 9 weeks: table [ [ Activity
Using the information provided in the table, the network diagram and the expected project completion time weeks:
tableActivitytableOptimistic TimeweekstableMost Likely TimeweekstablePessimistic TimeweeksABCDEFGH
The critical path is ABDGH
Round your answers to decimal places, eg
a Calculate the probability of completing the project in weeks.
project
b Calculate the probability of completing the project in weeks.
project
Step by Step Solution
There are 3 Steps involved in it
1 Expert Approved Answer
Step: 1 Unlock

Question Has Been Solved by an Expert!
Get step-by-step solutions from verified subject matter experts
Step: 2 Unlock
Step: 3 Unlock