

Question: Using the integrals of the coefficients for the Complex Exponential Fourier Series to obtain the frequency content of the signal in Figure 1. Provide the
Using the integrals of the coefficients for the Complex Exponential Fourier Series to obtain the frequency content of the signal in Figure 1. Provide the mathematical expression of the solution to the coefficients.
A1f2a-1.jpg
Figure 1. Signal for problem 1
2. Plot in MATLAB the magnitude of the coefficients as the value of n varies (e.g., from -10 to +10), and provide a table with these values (n=-10 to +10). Consider A=1, To=1. Recall that this plot must be discrete.
3. Obtain the Fourier transform consisting of only one period of the signal in Figure 1.
4. Plot the magnitude of the Fourier transform (recall that it is a continuous function of frequency) for the same values A=1, To=1; Discuss similarities and differences between the plots in part 2 and part 4.
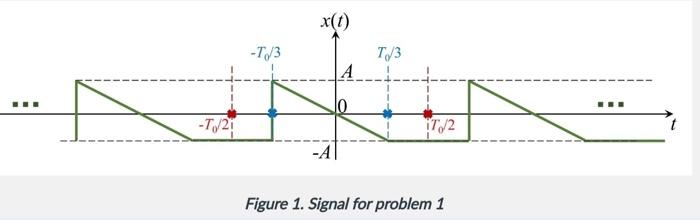
Figure 1. Signal for problem 1
Step by Step Solution
There are 3 Steps involved in it
1 Expert Approved Answer
Step: 1 Unlock

Question Has Been Solved by an Expert!
Get step-by-step solutions from verified subject matter experts
Step: 2 Unlock
Step: 3 Unlock