

Question: Using the iris data set .txt file which can be found here: https://archive.ics.uci.edu/ml/machine-learning-databases/iris/iris.data For each of the two datasets, create a separate scatter plot in
Using the iris data set .txt file which can be found here: https://archive.ics.uci.edu/ml/machine-learning-databases/iris/iris.data
For each of the two datasets, create a separate scatter plot in which the training data from the two classes isplotted in different colors.
Also, Write the function to compute the points on the decision boundary. In particular, you only need to make sure is set correctly using slop1, slop2, bias . Plot the data and decision boundary corresponding to the logistic regression classifier ( sklearn.linear_model.LogisticRegression ) on dataset A, and again on dataset B.
Below is a template for the code:
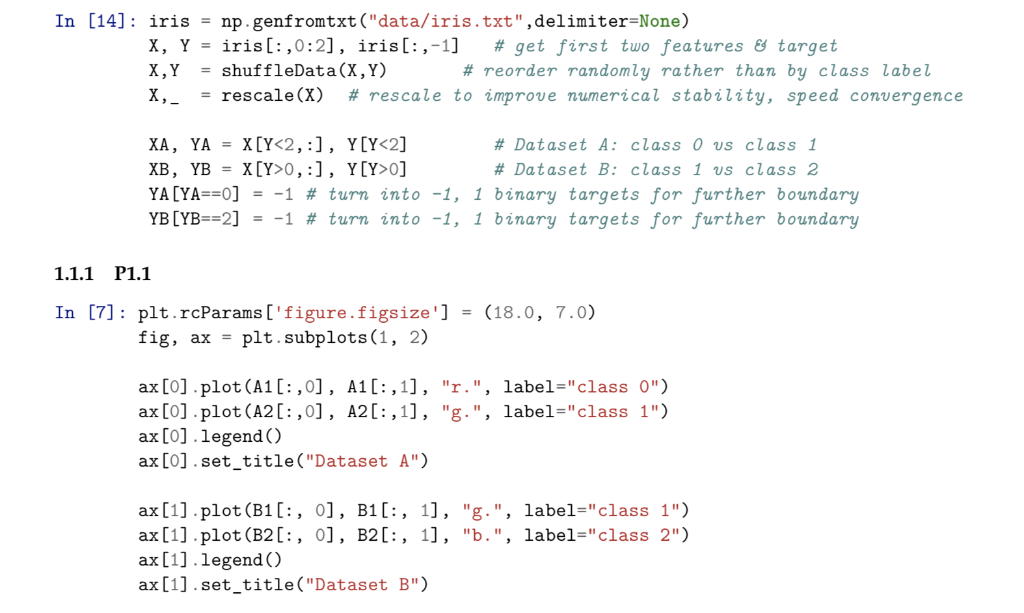
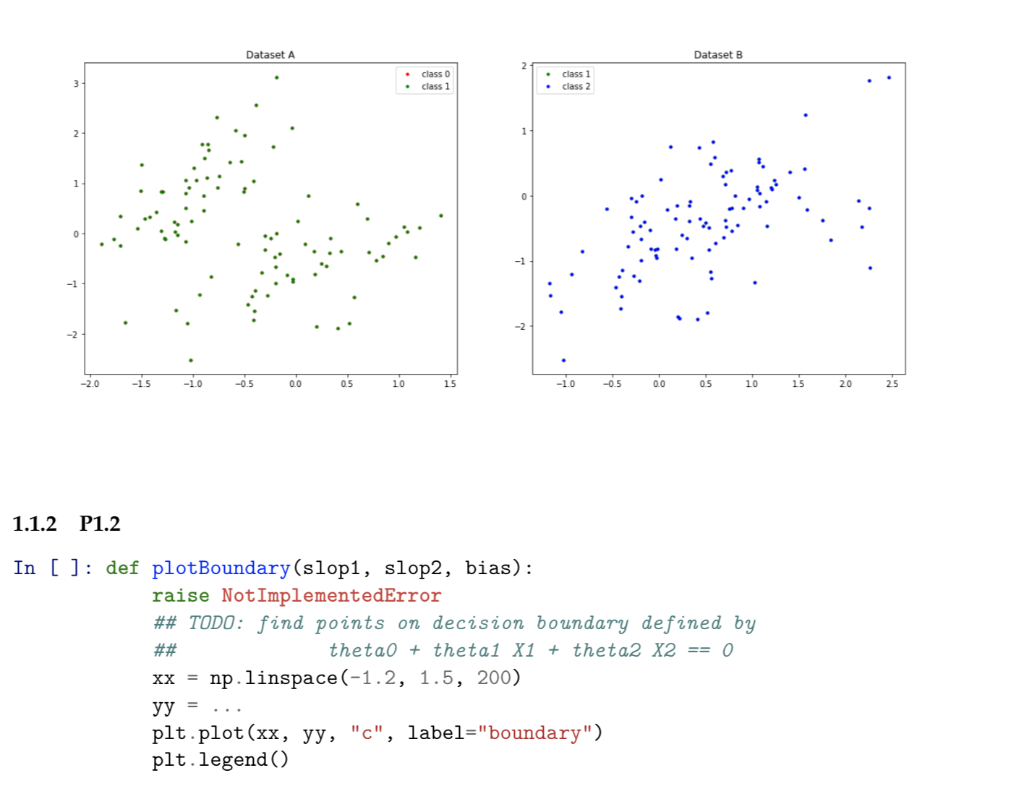
In [14] : np . genfromtxt ("data/iris.txt ", delimiter-None) iris X, Y = iris[: ,0:2], iris[: ,-1] # get first two features target X,Y = shuffleData(X,Y) x,- = rescale(X) # rescale to improve numerical stability, speed convergence = # reorder randomly rather than by class label # Dataset A: class 0 s class 1 # Dataset B: class 1 s class 2 YALYAz=0] =-1 # turn into -1, 1 binary targets for further boundary YBLYB--2] --1 # turn into -1, 1 binary targets for further boundary 1.1.1 P1.1 t71: plt.raParamit subprets (gs ize'). In (18.0, 7.0) fig, ax- plt.subplots(1, 2) ax [0].plot (A 1[:,0], A1 [ :,1], ax [o].plot (A2C:,0], A20:,1], ax [O] legend) ax [0].set_title("Dataset A") "r.", "g.", label="class label-"class 0") 1") ax [1] .plot (B1(: , ] , B1 [ : , ], "g.", label-"class 1") ax[11 plot (B2[:, o], B2l:, 11, "b.", label-"class 2") ax [1].legend) ax[1].set title ("Dataset B") Dataset A Dataset B *class . class 1 class 1 . class 2 -1 -2.0 -0.5 0.0 0.5 10 15 -0.5 0.0 0.5 10 15 2.0 25 1.1.2 P1.2 In [ ]: def plotBoundary (slop1, slop2, bias) raise NotimplementedError ## TODO: find points on decision boundary defined by xxnp.linspace (-1.2, 1.5, 200) plt . plot (xx, yy, "C", label-"boundary") pit. legend ( ) In [14] : np . genfromtxt ("data/iris.txt ", delimiter-None) iris X, Y = iris[: ,0:2], iris[: ,-1] # get first two features target X,Y = shuffleData(X,Y) x,- = rescale(X) # rescale to improve numerical stability, speed convergence = # reorder randomly rather than by class label # Dataset A: class 0 s class 1 # Dataset B: class 1 s class 2 YALYAz=0] =-1 # turn into -1, 1 binary targets for further boundary YBLYB--2] --1 # turn into -1, 1 binary targets for further boundary 1.1.1 P1.1 t71: plt.raParamit subprets (gs ize'). In (18.0, 7.0) fig, ax- plt.subplots(1, 2) ax [0].plot (A 1[:,0], A1 [ :,1], ax [o].plot (A2C:,0], A20:,1], ax [O] legend) ax [0].set_title("Dataset A") "r.", "g.", label="class label-"class 0") 1") ax [1] .plot (B1(: , ] , B1 [ : , ], "g.", label-"class 1") ax[11 plot (B2[:, o], B2l:, 11, "b.", label-"class 2") ax [1].legend) ax[1].set title ("Dataset B") Dataset A Dataset B *class . class 1 class 1 . class 2 -1 -2.0 -0.5 0.0 0.5 10 15 -0.5 0.0 0.5 10 15 2.0 25 1.1.2 P1.2 In [ ]: def plotBoundary (slop1, slop2, bias) raise NotimplementedError ## TODO: find points on decision boundary defined by xxnp.linspace (-1.2, 1.5, 200) plt . plot (xx, yy, "C", label-"boundary") pit. legend ( )
Step by Step Solution
There are 3 Steps involved in it

Get step-by-step solutions from verified subject matter experts