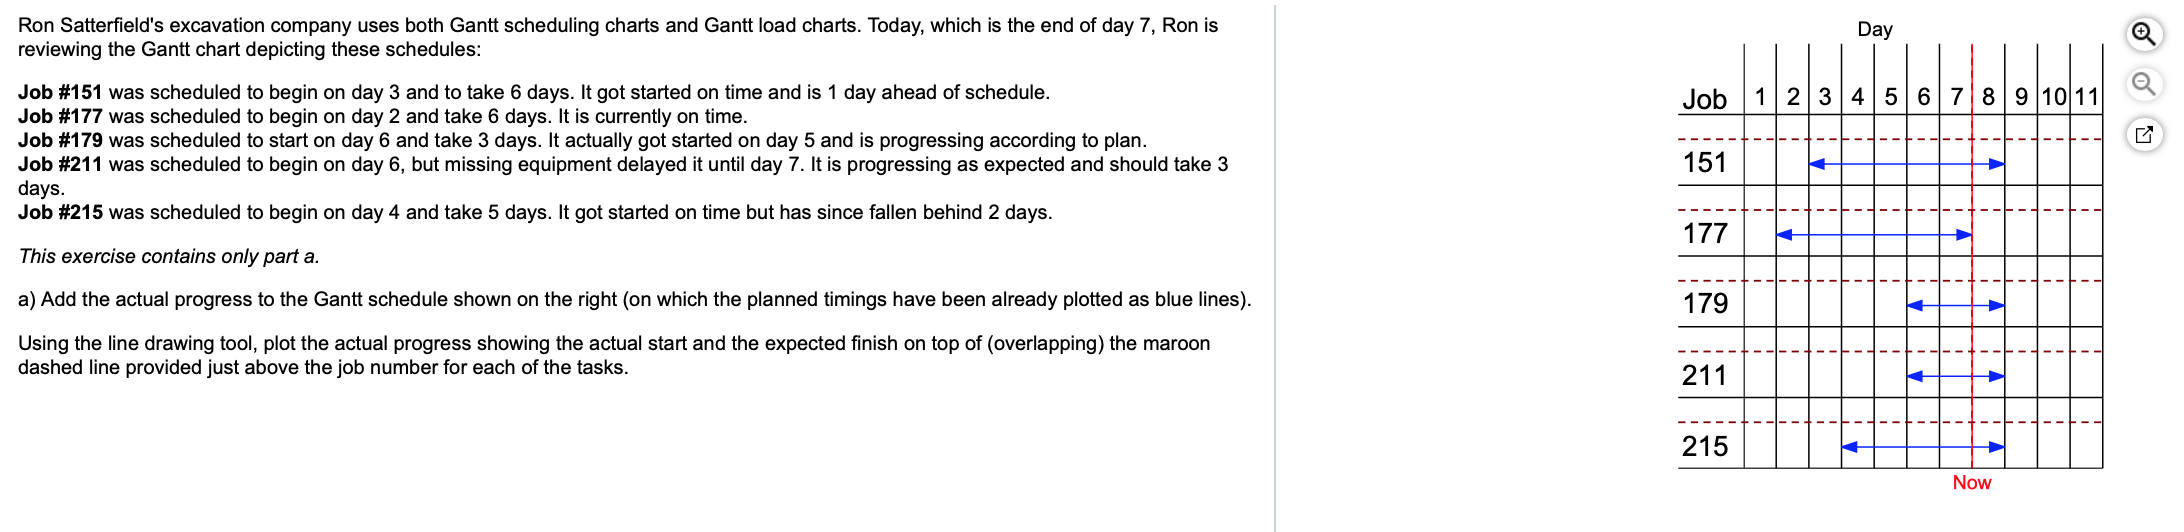
Question: Using the line drawing tool, plot the actual progress showing the actual start and the expected finish on top of (overlapping) the maroon dashed line

Using the line drawing tool, plot the actual progress showing the actual start and the expected finish on top of (overlapping) the maroon dashed line provided just above the job number for each of the tasks.

Using the line drawing tool, plot the actual

Ron Satterfield's excavation company uses both Gantt scheduling charts and Gantt load charts. Today, which is the end of day 7, Ron is reviewing the Gantt chart depicting these schedules: Day Job 1 2 3 4 5 6 7 8 9 10 11 Job #151 was scheduled to begin on day 3 and to take 6 days. It got started on time and is 1 day ahead of schedule. Job #177 was scheduled to begin on day 2 and take 6 days. It is currently on time. Job #179 was scheduled to start on day 6 and take 3 days. It actually got started on day 5 and is progressing according to plan. Job #211 was scheduled to begin on day 6, but missing equipment delayed it until day 7. It is progressing as expected and should take 3 days. Job #215 was scheduled to begin on day 4 and take 5 days. It got started on time but has since fallen behind 2 days. 151 --- 177 + 12 This exercise contains only part a. a) Add the actual progress to the Gantt schedule shown on the right (on which the planned timings have been already plotted as blue lines). 179 Using the line drawing tool, plot the actual progress showing the actual start and the expected finish on top of (overlapping) the maroon dashed line provided just above the job number for each of the tasks. 211 215 Now

Step by Step Solution

There are 3 Steps involved in it

1 Expert Approved Answer
Step: 1 Unlock blur-text-image
Question Has Been Solved by an Expert!

Get step-by-step solutions from verified subject matter experts

Step: 2 Unlock
Step: 3 Unlock

Students Have Also Explored These Related General Management Questions!