

Question: Using the MPG dataset (ggplot2) in R. Now, letting X1,,Xn be a random sample of size n from mpgshwy, your task is to plot the
Using the MPG dataset (ggplot2) in R.
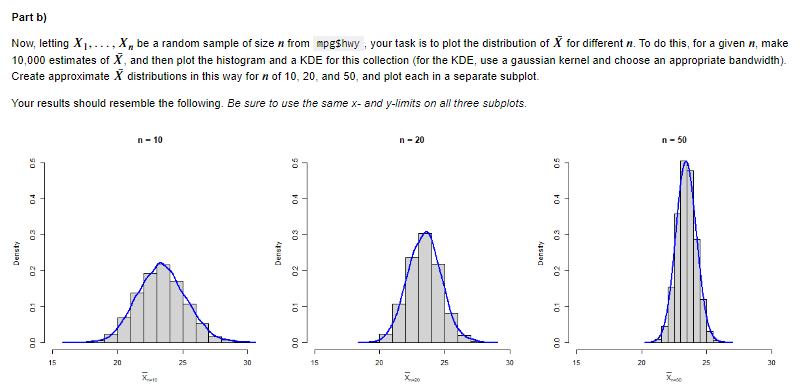
Now, letting X1,,Xn be a random sample of size n from mpgshwy, your task is to plot the distribution of X for different n. To do this, for a given n, make 10,000 estimates of X, and then plot the histogram and a KDE for this collection (for the KDE, use a gaussian kernel and choose an appropriate bandwidth). Create approximate X distributions in this way for n of 10,20 , and 50 , and plot each in a separate subplot. Your results should resemble the following. Be sure to use the same x-and y-limits on all three subplots
Step by Step Solution
There are 3 Steps involved in it
1 Expert Approved Answer
Step: 1 Unlock

Question Has Been Solved by an Expert!
Get step-by-step solutions from verified subject matter experts
Step: 2 Unlock
Step: 3 Unlock