

Question: Using the Penn World table version 10.0: ( download the following data for 2009 and 2019 for Canada and India: Output-side real GDP at chained
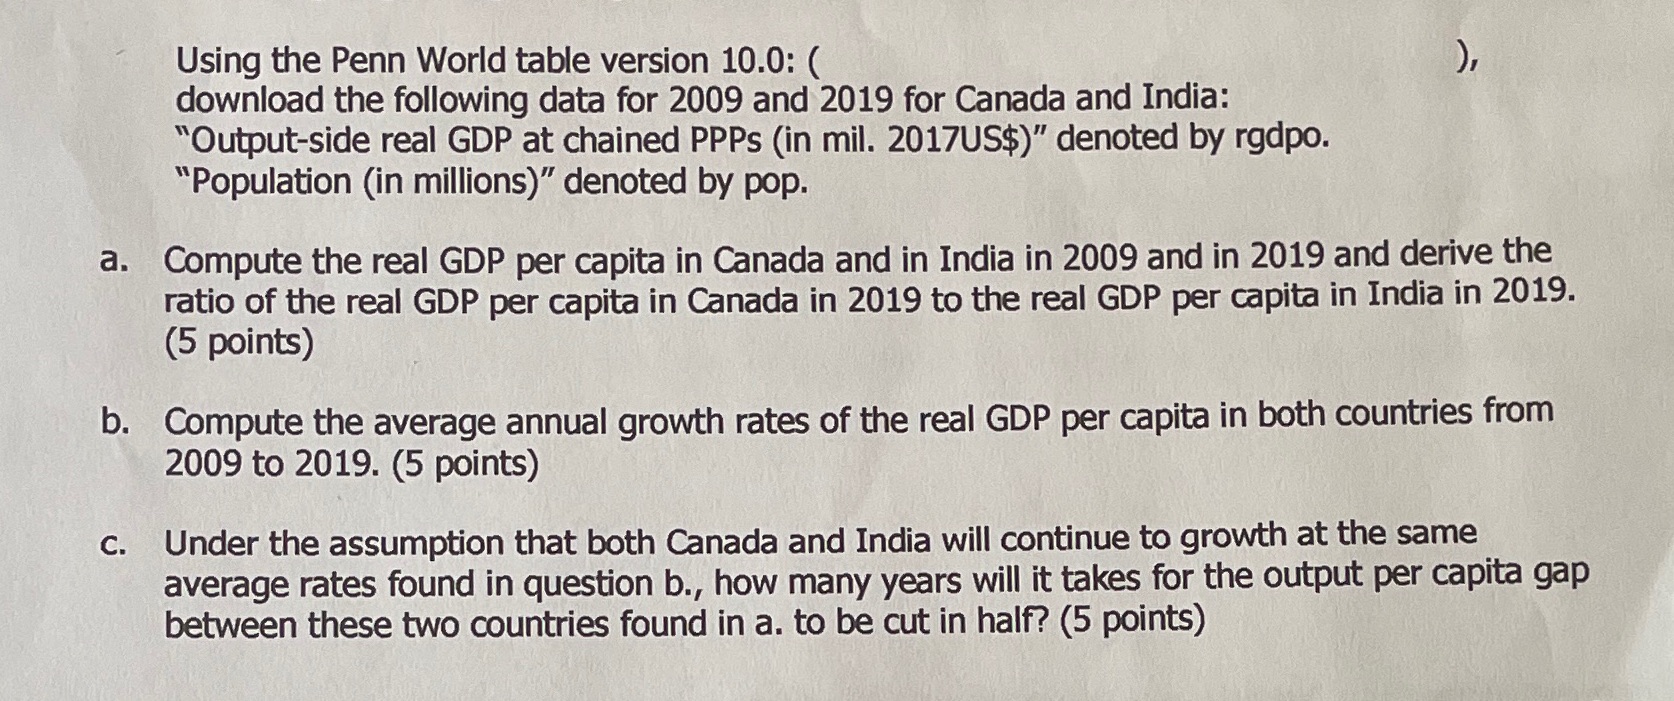

Using the Penn World table version 10.0: ( download the following data for 2009 and 2019 for Canada and India: "Output-side real GDP at chained PPPs (in mil. 2017US$)" denoted by rgdpo. "Population (in millions)" denoted by pop. a. Compute the real GDP per capita in Canada and in India in 2009 and in 2019 and derive the ratio of the real GDP per capita in Canada in 2019 to the real GDP per capita in India in 2019. (5 points) b. Compute the average annual growth rates of the real GDP per capita in both countries from 2009 to 2019. (5 points) c. Under the assumption that both Canada and India will continue to growth at the same average rates found in question b., how many years will it takes for the output per capita gap between these two countries found in a. to be cut in half? (5 points)
Step by Step Solution
There are 3 Steps involved in it

Get step-by-step solutions from verified subject matter experts