

Question: Using the Prescriptive_trionym.xlsx sheet and reference of Trionym case Submit the sheet for doing sensitivity analysis by assessing impact on Project Evaluation(investment decision) if probability
Using the Prescriptive_trionym.xlsx sheet and reference of Trionym case Submit the sheet for doing sensitivity analysis by assessing impact on Project Evaluation(investment decision) if probability of an 80% COGS is increased to 75%
In the case, it is given that probability is 60% in order to have COGS 80% of gross sales (i.e. expenses will be 80% of revenue) and probability is 40% in order to have COGS 70% of gross sales. Now assignment task is that with new information it said that probability is 75% in order to have COGS 80% of gross sales and remaining i.e. probability is 25% in order to have COGS 70% of gross sales. All you have to do is change in the provided solution sheet this probability values and find impact on investment decision i.e. project evaluation. This is called sensitivity analysis giving decision maker information that based on variables and assumed values how sensitive is the decision-making criteria.
Solve all the assignments.
please see clear picture below...
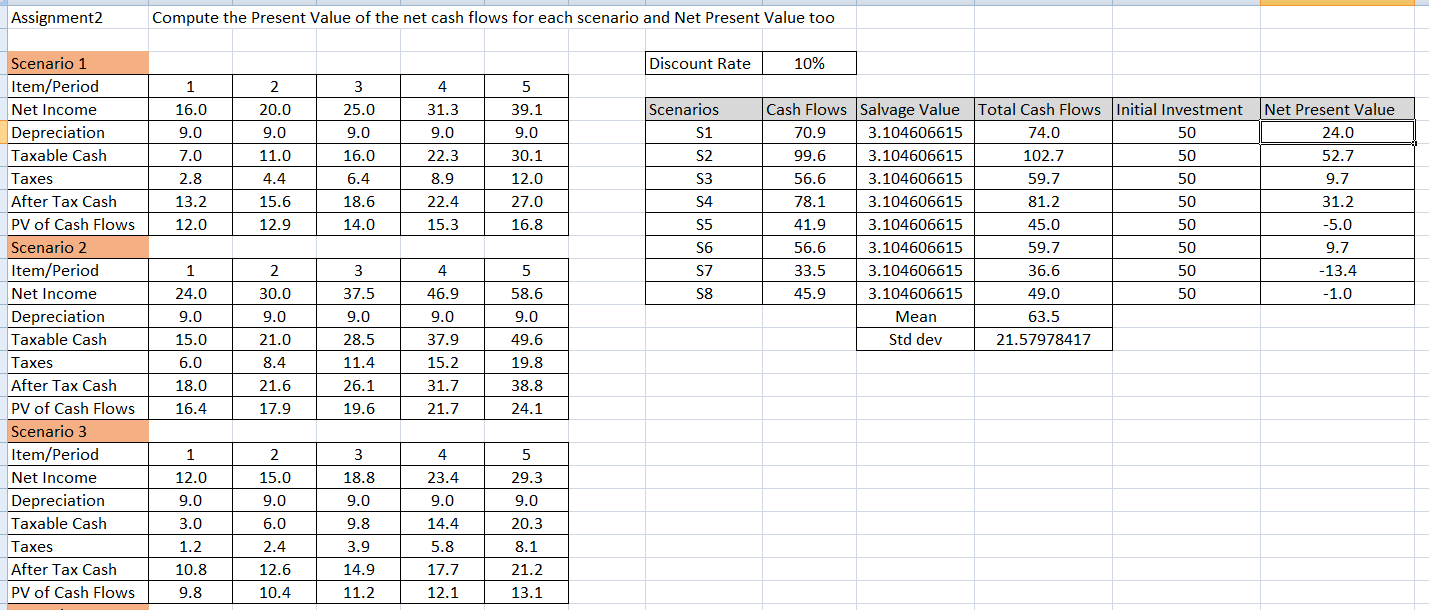
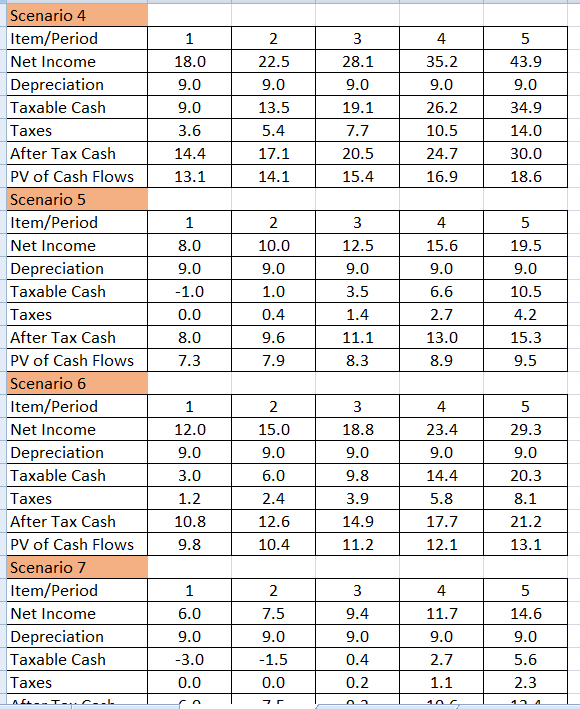
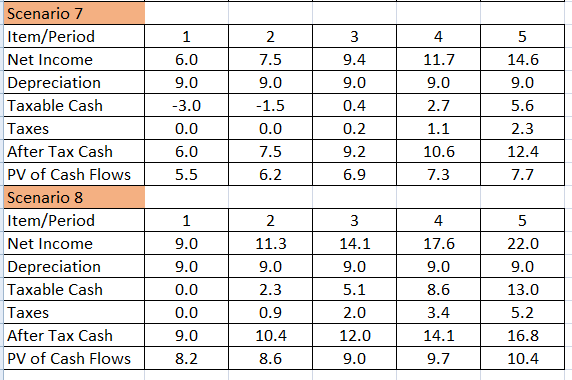
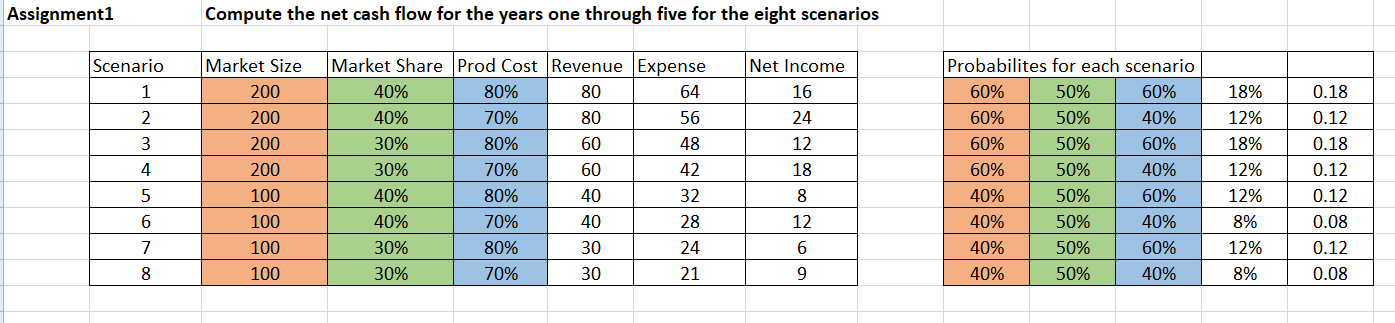
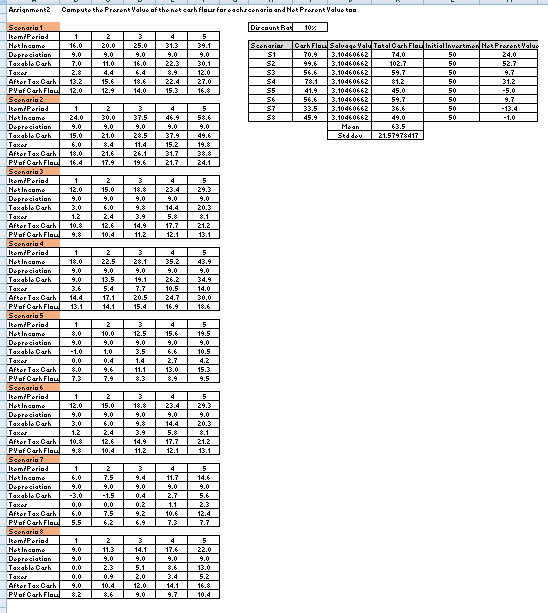
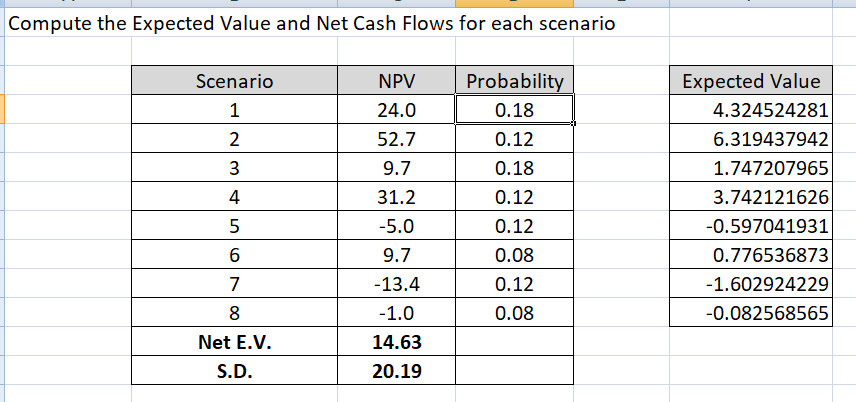
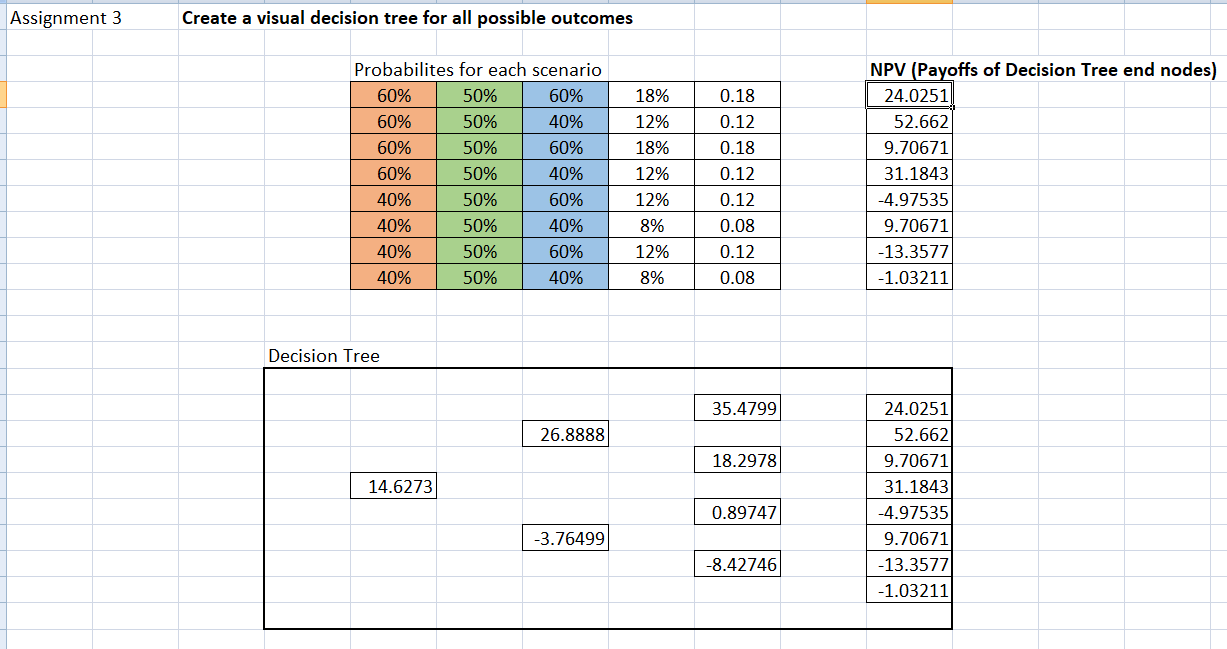
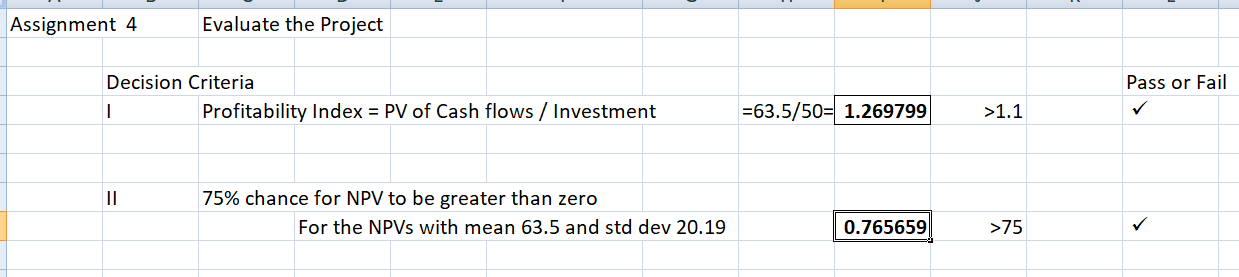
Assignment1 Compute the net cash flow for the years one through five for the eight scenarios Scenario Net Income 16 0.18 1 2 24 Market Size 200 200 200 200 100 100 100 100 3 4 5 6 Market Share Prod Cost Revenue Expense 40% 80% 80 64 40% 70% 80 56 30% 80% 60 48 30% 70% 60 42 40% 80% 40 32 40% 70% 40 28 30% 80% 30 24 30% 30 21 12 18 Probabilites for each scenario 60% 50% 60% 60% 50% 40% 60% 50% 60% 60% 50% 40% 40% 50% 60% 40% 50% 40% 40% 50% 60% 40% 50% 18% 12% 18% 12% 12% 8% 12% 8% 8 0.12 0.18 0.12 0.12 0.08 0.12 0.08 12 7 8 6 9 70% 40% Arrignment2 Computo the Prevent Value of the net carh flour for eachrcenaria and Not Procent Value to Discount Rat 102 1 16.0 9.0 7.0 2.8 13.2 12.0 4 31.3 9.0 22.3 5 39.1 Scenarier S1 S2 20.0 9.0 11.0 4.4 15.6 12.9 25.0 9.0 16.0 6.4 18.6 14.0 30.1 12.0 27.0 16.8 22.4 15.3 54 S5 S6 S7 58 Carh Flou Salva Vall Total Carh Floc InitialInverter Not Prorent Value 70.9 3.10460662 74.0 50 24.0 99.6 3.10460662 102.7 50 52.7 56.6 3.10460662 54.7 50 9.7 3.10460662 50 31.2 41.9 3.10460662 45.0 50 -5.0 56.6 3.10460662 59.7 50 9.7 33.5 3.10460662 50 - 13.4 45.9 3.10460662 49.0 50 -1.0 Mean 63.5 Std dev 21.57478417 1 24.0 9.0 15.0 6.0 18.0 16.4 2 30.0 9.0 21.0 4 46.9 9.0 37.5 9.0 28.5 11.4 26.1 19.6 5 58.6 9.0 49.6 19.8 21.6 17.9 15.2 31.7 21.7 24.1 5 3 18.8 9.0 12.0 9.0 3.0 1.2 10.8 2 15.0 9.0 6.0 2.4 12.6 10.4 4 23.4 9.0 14.4 5.8 17.7 12.1 9.0 20.3 8.1 21.2 13.1 14.9 11.2 4 1 18.0 9.0 9.0 3.6 14.4 13.1 2 22.5 9.0 13.5 5.4 17.1 14.1 28.1 9.0 19.1 7.7 20.5 15.4 9.0 26.2 10.5 24.7 16.9 5 43.9 9.0 34.9 14.0 30.0 18.6 Scenario 1 Item/Period Net Income Depreciation Taxable Carh Taxo After Tax Carh PV of Carh Flour Scenario 2 Itemi Period Net Income Depreciation Taxable Carh Taxe After Tax Carh PV of Carl Flau Scenaria 3 Item/Period Not Income Depreciation Taxable Carh Taxer After Tax Carh PV of Carh Flow Scenaria 4 Item/Period Net Income Depreciation Taxablo Carh Taxo After Tax Carh PV of Carh Flaul Scenario 5 Item/Poriad Net Income Depreciation Taxablo Carl Taxe After Tax Carh PV af Carl Flau. Scenario Item/Period Net Income Depreciation Taxablo Carl Taxe After Tax Carh PV of Carh Flow Scenaria 7 ItomiPeriod Not Income Depreciation Taxable or Taxor After Tax Carh Pof Carh Flou Scenaria 8 Item/Period Net Income Depreciation Taxable Carh Taxor After Tax Carh PV of Carh Flow 1 8.0 2 10.0 9.0 1.0 0.4 -1.0 0.0 8.0 12.5 9.0 3.5 1.4 11.1 4 15.6 9.0 6.6 2.7 13.0 8.9 5 19.5 9.0 10.5 4.2 15.3 9.5 7.9 18.8 9.0 1 12.0 9.0 3.0 1.2 10.8 2 15.0 9.0 6.0 2.4 12.6 10.4 5 29.3 9.0 20.3 23.4 9.0 14.4 5.8 17.7 12.1 14.9 11.2 21.2 13.1 1 6.0 9.0 2 7.5 9.0 -1.5 0.0 7.5 6.2 9.4 9.0 0.4 0.2 9.2 11.7 9.0 2.7 1.1 10.6 7.3 5 14.6 9.0 5.6 2.3 12.4 7.7 0.0 6.0 5.5 1 4.0 9.0 0.0 0.0 9.0 8.2 2 11.3 9.0 2.3 0.9 10.4 14.1 9.0 5.1 2.0 12.0 9.0 17.6 9.0 8.6 3.4 14.1 9.7 5 22.0 4.0 13.0 5.2 16.8 10.4 Compute the Expected Value and Net Cash Flows for each scenario Probability 0.18 Scenario 1 2 3 WN NPV 24.0 52.7 9.7 31.2 -5.0 9.7 4 Expected Value 4.324524281 6.319437942 1.747207965 3.742121626 -0.597041931 0.776536873 -1.602924229 -0.082568565 0.12 0.18 0.12 0.12 0.08 0.12 0.08 5 6 7 8 Net E.V. S.D. -13.4 -1.0 14.63 20.19 Assignment 3 Create a visual decision tree for all possible outcomes Probabilites for each scenario 60% 50% 60% 60% 50% 40% 60% 50% 60% 60% 50% 40% 40% 50% 60% 40% 50% 40% 40% 50% 60% 40% 50% 40% 18% 12% 18% 12% 12% 8% 12% 8% 0.18 0.12 0.18 0.12 0.12 0.08 0.12 0.08 NPV (Payoffs of Decision Tree end nodes) 24.0251 52.662 9.70671 31.1843 -4.97535 9.70671 -13.3577 -1.03211 Decision Tree 35.4799 26.8888 18.2978 14.6273 24.0251 52.662 9.70671 31.1843 -4.97535 9.70671 -13.3577 -1.03211 0.89747 -3.76499 -8.42746 Assignment 4 Evaluate the Project Decision Criteria I Profitability Index = PV of Cash flows / Investment Pass or Fail =63.5/50= 1.269799 >1.1 11 75% chance for NPV to be greater than zero For the NPVs with mean 63.5 and std dev 20.19 0.765659 >75 Assignment2 Compute the Present Value of the net cash flows for each scenario and Net Present Value too Discount Rate 10% 4 3 25.0 2 20.0 9.0 11.0 4.4 31.3 9.0 1 16.0 9.0 7.0 2.8 13.2 12.0 Scenarios S1 9.0 16.0 6.4 18.6 14.0 S2 5 39.1 9.0 30.1 12.0 27.0 16.8 22.3 8.9 22.4 S3 15.6 12.9 S4 S5 S6 Total Cash Flows Initial Investment 74.0 50 102.7 50 59.7 50 81.2 50 45.0 50 59.7 50 36.6 50 49.0 50 15.3 Cash Flows Salvage Value 70.9 3.104606615 99.6 3.104606615 56.6 3.104606615 78.1 3.104606615 3.104606615 56.6 3.104606615 33.5 3.104606615 45.9 3.104606615 Mean Std dev Net Present Value 24.0 52.7 9.7 31.2 -5.0 9.7 -13.4 -1.0 41.9 1 3 4 S7 2 30.0 5 58.6 37.5 S8 46.9 9.0 9.0 Scenario 1 Item/Period Net Income Depreciation Taxable Cash Taxes After Tax Cash PV of Cash Flows Scenario 2 Item/Period Net Income Depreciation Taxable Cash Taxes After Tax Cash PV of Cash Flows Scenario 3 Item/Period Net Income Depreciation Taxable Cash Taxes After Tax Cash PV of Cash Flows 9.0 24.0 9.0 15.0 6.0 18.0 9.0 49.6 19.8 63.5 21.57978417 28.5 11.4 21.0 8.4 21.6 17.9 37.9 15.2 31.7 21.7 26.1 38.8 24.1 16.4 19.6 1 4 2 15.0 9.0 3 18.8 12.0 9.0 3.0 1.2 10.8 9.8 6.0 2.4 12.6 10.4 9.0 9.8 3.9 14.9 11.2 23.4 9.0 14.4 5.8 17.7 12.1 5 29.3 9.0 20.3 8.1 21.2 13.1 3 4 1 18.0 9.0 9.0 3.6 14.4 13.1 2 22.5 9.0 13.5 5.4 17.1 14.1 28.1 9.0 19.1 7.7 20.5 15.4 35.2 9.0 26.2 10.5 24.7 16.9 5 43.9 9.0 34.9 14.0 30.0 18.6 3 5 19.5 9.0 Scenario 4 Item/Period Net Income Depreciation Taxable Cash Taxes After Tax Cash PV of Cash Flows Scenario 5 Item/Period Net Income Depreciation Taxable Cash Taxes After Tax Cash PV of Cash Flows Scenario 6 Item/Period Net Income Depreciation Taxable Cash Taxes After Tax Cash PV of Cash Flows Scenario 7 Item/Period Net Income Depreciation Taxable Cash Taxes 1 8.0 9.0 -1.0 0.0 8.0 7.3 2 10.0 9.0 1.0 0.4 9.6 7.9 12.5 9.0 3.5 1.4 11.1 8.3 4 15.6 9.0 6.6 2.7 13.0 8.9 10.5 4.2 15.3 9.5 1 12.0 9.0 3.0 1.2 10.8 9.8 2 15.0 9.0 6.0 2.4 12.6 10.4 3 18.8 9.0 9.8 3.9 14.9 11.2 4 23.4 9.0 14.4 5.8 17.7 12.1 5 29.3 9.0 20.3 8.1 21.2 13.1 5 1 6.0 9.0 -3.0 0.0 2 7.5 9.0 -1.5 0.0 3 9.4 9.0 0.4 0.2 4 11.7 9.0 2.7 14.6 9.0 5.6 1.1 2.3 7 10C 124 1 6.0 9.0 -3.0 0.0 6.0 5.5 2. 7.5 9.0 -1.5 0.0 7.5 6.2 3 9.4 9.0 0.4 0.2 9.2 6.9 4 11.7 9.0 2.7 1.1 10.6 7.3 5 14.6 9.0 5.6 2.3 12.4 7.7 Scenario 7 Item/Period Net Income Depreciation Taxable Cash Taxes After Tax Cash PV of Cash Flows Scenario 8 Item/Period Net Income Depreciation Taxable Cash Taxes After Tax Cash PV of Cash Flows 4 5 17.6 9.0 1 9.0 9.0 0.0 0.0 9.0 8.2 2 11.3 9.0 2.3 0.9 10.4 8.6 3 14.1 9.0 5.1 2.0 12.0 8.6 22.0 9.0 13.0 5.2 16.8 10.4 3.4 14.1 9.7 9.0 Assignment1 Compute the net cash flow for the years one through five for the eight scenarios Scenario Net Income 16 0.18 1 2 24 Market Size 200 200 200 200 100 100 100 100 3 4 5 6 Market Share Prod Cost Revenue Expense 40% 80% 80 64 40% 70% 80 56 30% 80% 60 48 30% 70% 60 42 40% 80% 40 32 40% 70% 40 28 30% 80% 30 24 30% 30 21 12 18 Probabilites for each scenario 60% 50% 60% 60% 50% 40% 60% 50% 60% 60% 50% 40% 40% 50% 60% 40% 50% 40% 40% 50% 60% 40% 50% 18% 12% 18% 12% 12% 8% 12% 8% 8 0.12 0.18 0.12 0.12 0.08 0.12 0.08 12 7 8 6 9 70% 40% Arrignment2 Computo the Prevent Value of the net carh flour for eachrcenaria and Not Procent Value to Discount Rat 102 1 16.0 9.0 7.0 2.8 13.2 12.0 4 31.3 9.0 22.3 5 39.1 Scenarier S1 S2 20.0 9.0 11.0 4.4 15.6 12.9 25.0 9.0 16.0 6.4 18.6 14.0 30.1 12.0 27.0 16.8 22.4 15.3 54 S5 S6 S7 58 Carh Flou Salva Vall Total Carh Floc InitialInverter Not Prorent Value 70.9 3.10460662 74.0 50 24.0 99.6 3.10460662 102.7 50 52.7 56.6 3.10460662 54.7 50 9.7 3.10460662 50 31.2 41.9 3.10460662 45.0 50 -5.0 56.6 3.10460662 59.7 50 9.7 33.5 3.10460662 50 - 13.4 45.9 3.10460662 49.0 50 -1.0 Mean 63.5 Std dev 21.57478417 1 24.0 9.0 15.0 6.0 18.0 16.4 2 30.0 9.0 21.0 4 46.9 9.0 37.5 9.0 28.5 11.4 26.1 19.6 5 58.6 9.0 49.6 19.8 21.6 17.9 15.2 31.7 21.7 24.1 5 3 18.8 9.0 12.0 9.0 3.0 1.2 10.8 2 15.0 9.0 6.0 2.4 12.6 10.4 4 23.4 9.0 14.4 5.8 17.7 12.1 9.0 20.3 8.1 21.2 13.1 14.9 11.2 4 1 18.0 9.0 9.0 3.6 14.4 13.1 2 22.5 9.0 13.5 5.4 17.1 14.1 28.1 9.0 19.1 7.7 20.5 15.4 9.0 26.2 10.5 24.7 16.9 5 43.9 9.0 34.9 14.0 30.0 18.6 Scenario 1 Item/Period Net Income Depreciation Taxable Carh Taxo After Tax Carh PV of Carh Flour Scenario 2 Itemi Period Net Income Depreciation Taxable Carh Taxe After Tax Carh PV of Carl Flau Scenaria 3 Item/Period Not Income Depreciation Taxable Carh Taxer After Tax Carh PV of Carh Flow Scenaria 4 Item/Period Net Income Depreciation Taxablo Carh Taxo After Tax Carh PV of Carh Flaul Scenario 5 Item/Poriad Net Income Depreciation Taxablo Carl Taxe After Tax Carh PV af Carl Flau. Scenario Item/Period Net Income Depreciation Taxablo Carl Taxe After Tax Carh PV of Carh Flow Scenaria 7 ItomiPeriod Not Income Depreciation Taxable or Taxor After Tax Carh Pof Carh Flou Scenaria 8 Item/Period Net Income Depreciation Taxable Carh Taxor After Tax Carh PV of Carh Flow 1 8.0 2 10.0 9.0 1.0 0.4 -1.0 0.0 8.0 12.5 9.0 3.5 1.4 11.1 4 15.6 9.0 6.6 2.7 13.0 8.9 5 19.5 9.0 10.5 4.2 15.3 9.5 7.9 18.8 9.0 1 12.0 9.0 3.0 1.2 10.8 2 15.0 9.0 6.0 2.4 12.6 10.4 5 29.3 9.0 20.3 23.4 9.0 14.4 5.8 17.7 12.1 14.9 11.2 21.2 13.1 1 6.0 9.0 2 7.5 9.0 -1.5 0.0 7.5 6.2 9.4 9.0 0.4 0.2 9.2 11.7 9.0 2.7 1.1 10.6 7.3 5 14.6 9.0 5.6 2.3 12.4 7.7 0.0 6.0 5.5 1 4.0 9.0 0.0 0.0 9.0 8.2 2 11.3 9.0 2.3 0.9 10.4 14.1 9.0 5.1 2.0 12.0 9.0 17.6 9.0 8.6 3.4 14.1 9.7 5 22.0 4.0 13.0 5.2 16.8 10.4 Compute the Expected Value and Net Cash Flows for each scenario Probability 0.18 Scenario 1 2 3 WN NPV 24.0 52.7 9.7 31.2 -5.0 9.7 4 Expected Value 4.324524281 6.319437942 1.747207965 3.742121626 -0.597041931 0.776536873 -1.602924229 -0.082568565 0.12 0.18 0.12 0.12 0.08 0.12 0.08 5 6 7 8 Net E.V. S.D. -13.4 -1.0 14.63 20.19 Assignment 3 Create a visual decision tree for all possible outcomes Probabilites for each scenario 60% 50% 60% 60% 50% 40% 60% 50% 60% 60% 50% 40% 40% 50% 60% 40% 50% 40% 40% 50% 60% 40% 50% 40% 18% 12% 18% 12% 12% 8% 12% 8% 0.18 0.12 0.18 0.12 0.12 0.08 0.12 0.08 NPV (Payoffs of Decision Tree end nodes) 24.0251 52.662 9.70671 31.1843 -4.97535 9.70671 -13.3577 -1.03211 Decision Tree 35.4799 26.8888 18.2978 14.6273 24.0251 52.662 9.70671 31.1843 -4.97535 9.70671 -13.3577 -1.03211 0.89747 -3.76499 -8.42746 Assignment 4 Evaluate the Project Decision Criteria I Profitability Index = PV of Cash flows / Investment Pass or Fail =63.5/50= 1.269799 >1.1 11 75% chance for NPV to be greater than zero For the NPVs with mean 63.5 and std dev 20.19 0.765659 >75 Assignment2 Compute the Present Value of the net cash flows for each scenario and Net Present Value too Discount Rate 10% 4 3 25.0 2 20.0 9.0 11.0 4.4 31.3 9.0 1 16.0 9.0 7.0 2.8 13.2 12.0 Scenarios S1 9.0 16.0 6.4 18.6 14.0 S2 5 39.1 9.0 30.1 12.0 27.0 16.8 22.3 8.9 22.4 S3 15.6 12.9 S4 S5 S6 Total Cash Flows Initial Investment 74.0 50 102.7 50 59.7 50 81.2 50 45.0 50 59.7 50 36.6 50 49.0 50 15.3 Cash Flows Salvage Value 70.9 3.104606615 99.6 3.104606615 56.6 3.104606615 78.1 3.104606615 3.104606615 56.6 3.104606615 33.5 3.104606615 45.9 3.104606615 Mean Std dev Net Present Value 24.0 52.7 9.7 31.2 -5.0 9.7 -13.4 -1.0 41.9 1 3 4 S7 2 30.0 5 58.6 37.5 S8 46.9 9.0 9.0 Scenario 1 Item/Period Net Income Depreciation Taxable Cash Taxes After Tax Cash PV of Cash Flows Scenario 2 Item/Period Net Income Depreciation Taxable Cash Taxes After Tax Cash PV of Cash Flows Scenario 3 Item/Period Net Income Depreciation Taxable Cash Taxes After Tax Cash PV of Cash Flows 9.0 24.0 9.0 15.0 6.0 18.0 9.0 49.6 19.8 63.5 21.57978417 28.5 11.4 21.0 8.4 21.6 17.9 37.9 15.2 31.7 21.7 26.1 38.8 24.1 16.4 19.6 1 4 2 15.0 9.0 3 18.8 12.0 9.0 3.0 1.2 10.8 9.8 6.0 2.4 12.6 10.4 9.0 9.8 3.9 14.9 11.2 23.4 9.0 14.4 5.8 17.7 12.1 5 29.3 9.0 20.3 8.1 21.2 13.1 3 4 1 18.0 9.0 9.0 3.6 14.4 13.1 2 22.5 9.0 13.5 5.4 17.1 14.1 28.1 9.0 19.1 7.7 20.5 15.4 35.2 9.0 26.2 10.5 24.7 16.9 5 43.9 9.0 34.9 14.0 30.0 18.6 3 5 19.5 9.0 Scenario 4 Item/Period Net Income Depreciation Taxable Cash Taxes After Tax Cash PV of Cash Flows Scenario 5 Item/Period Net Income Depreciation Taxable Cash Taxes After Tax Cash PV of Cash Flows Scenario 6 Item/Period Net Income Depreciation Taxable Cash Taxes After Tax Cash PV of Cash Flows Scenario 7 Item/Period Net Income Depreciation Taxable Cash Taxes 1 8.0 9.0 -1.0 0.0 8.0 7.3 2 10.0 9.0 1.0 0.4 9.6 7.9 12.5 9.0 3.5 1.4 11.1 8.3 4 15.6 9.0 6.6 2.7 13.0 8.9 10.5 4.2 15.3 9.5 1 12.0 9.0 3.0 1.2 10.8 9.8 2 15.0 9.0 6.0 2.4 12.6 10.4 3 18.8 9.0 9.8 3.9 14.9 11.2 4 23.4 9.0 14.4 5.8 17.7 12.1 5 29.3 9.0 20.3 8.1 21.2 13.1 5 1 6.0 9.0 -3.0 0.0 2 7.5 9.0 -1.5 0.0 3 9.4 9.0 0.4 0.2 4 11.7 9.0 2.7 14.6 9.0 5.6 1.1 2.3 7 10C 124 1 6.0 9.0 -3.0 0.0 6.0 5.5 2. 7.5 9.0 -1.5 0.0 7.5 6.2 3 9.4 9.0 0.4 0.2 9.2 6.9 4 11.7 9.0 2.7 1.1 10.6 7.3 5 14.6 9.0 5.6 2.3 12.4 7.7 Scenario 7 Item/Period Net Income Depreciation Taxable Cash Taxes After Tax Cash PV of Cash Flows Scenario 8 Item/Period Net Income Depreciation Taxable Cash Taxes After Tax Cash PV of Cash Flows 4 5 17.6 9.0 1 9.0 9.0 0.0 0.0 9.0 8.2 2 11.3 9.0 2.3 0.9 10.4 8.6 3 14.1 9.0 5.1 2.0 12.0 8.6 22.0 9.0 13.0 5.2 16.8 10.4 3.4 14.1 9.7 9.0
Step by Step Solution
There are 3 Steps involved in it

Get step-by-step solutions from verified subject matter experts