

Question: Using the process map (swim-lane diagram) shown above, create a PFMEA for this Lean Six Sigma project (based on practices discussed in Analyze Phase, Lesson
Using the process map (swim-lane diagram) shown above, create a PFMEA for this Lean Six Sigma project (based on practices discussed in Analyze Phase, Lesson 2b, slides 18-31).
Swim-lane Diagram:
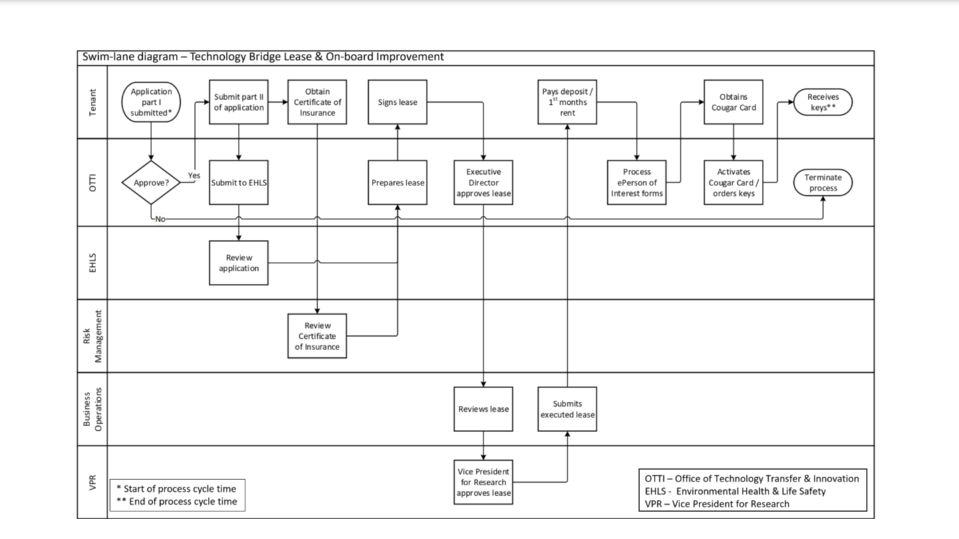
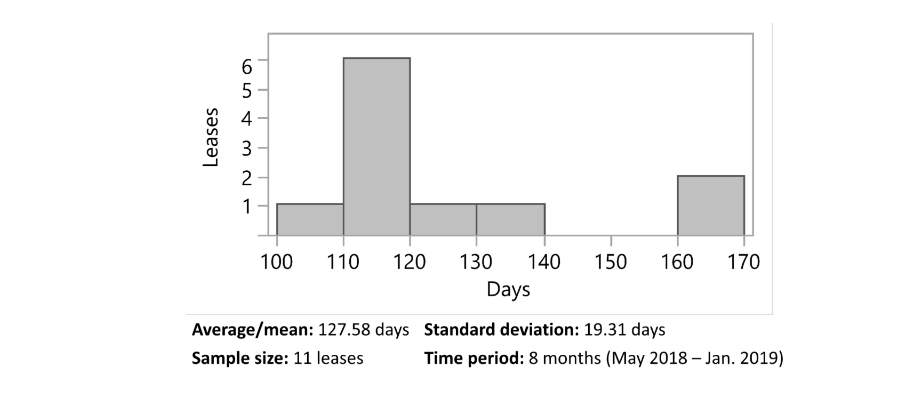
Problem Statement: The UH Technology Bridge time to on-board new tenants has averaged 128 days over the last eight months (May 2018 Jan. 2019), resulting in frustrated clients.
Mission statement: Reduce the UH Technology Bridge's average time to on-board new tenants to 45 days or less over the next six months (by July 2019), resulting in a reduction of frustrated clients.
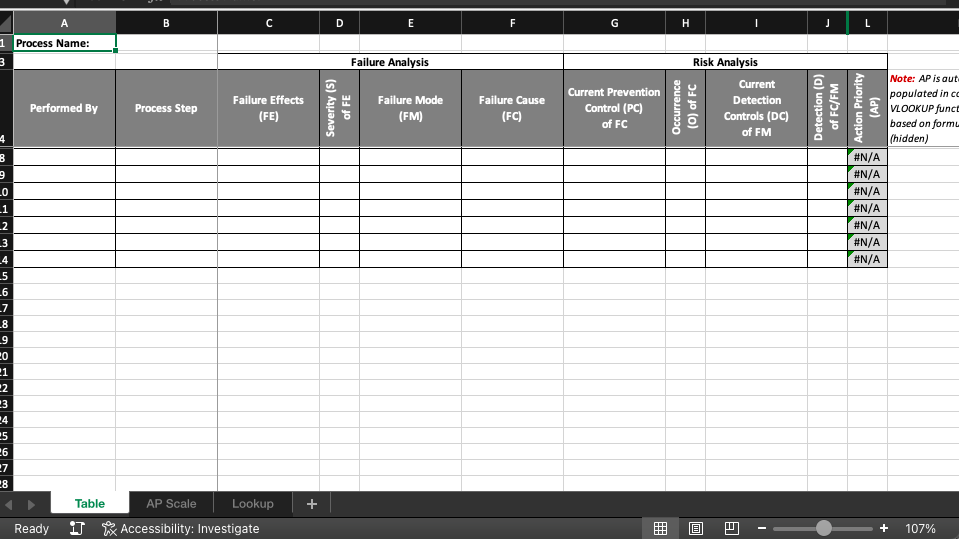
Attached is an Excel file to download and enter your responses. At minimum, you MUST complete 10 rows (that reflect the initial, up to 10, steps in the swim-lane diagram given) in the PFMEA table. Remember, this template will automatically populate the Action Priority (AP) column.
Quality Improvement in Project Management
Please help me fill out the boxes in the chart, and answer correctly.
Average/mean: 127.58 days Standard deviation: 19.31 days Sample size: 11 leases Time period: 8 months (May 2018 - Jan. 2019)
Step by Step Solution
There are 3 Steps involved in it

Get step-by-step solutions from verified subject matter experts