

Question: Using the provided Balance Sheet, Statement of Operations and benchmarks, please perform the following for ABC Community Hospital, a 190-bed acute care facility, for the
Using the provided Balance Sheet, Statement of Operations and benchmarks, please perform the following for ABC Community Hospital, a 190-bed acute care facility, for the years ended 20X0 and 20X1:
a. Perform a horizontal analysis on both statements b. Perform a vertical analysis on both statements relative to 20X0 c. Compute all financial metrics listed within the Ratios Template worksheet of the attached excel file for both 20X0 and 20X1 (use of provided template required) d. For each of the following ratio categories listed in the template, discuss the hospitals financial condition and performance during this time period, referencing key analytic findings, as appropriate. Please do not simply site calculated ratio amounts, but provide a possible rationale/basis for identified trending of metrics. You do not need to discuss all ratios calculated in the template. Select 2-3 and apply the framework used in the content.
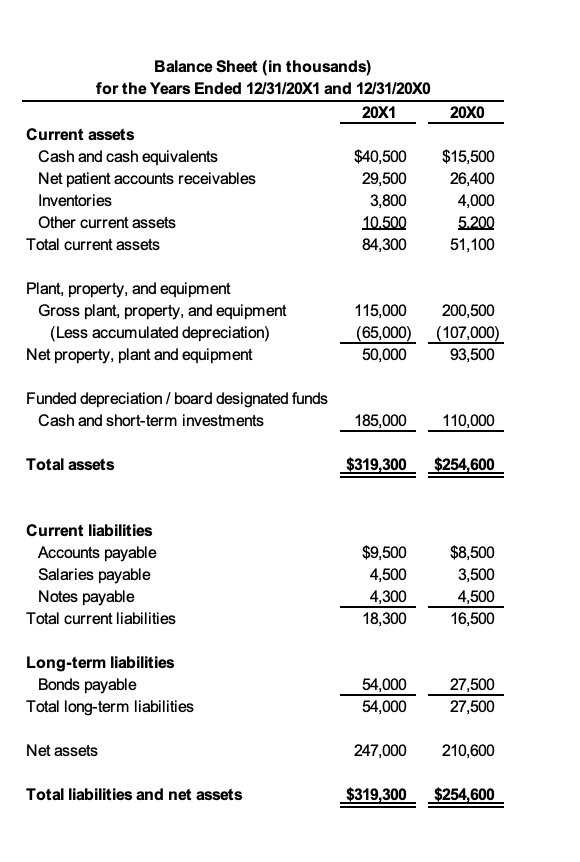
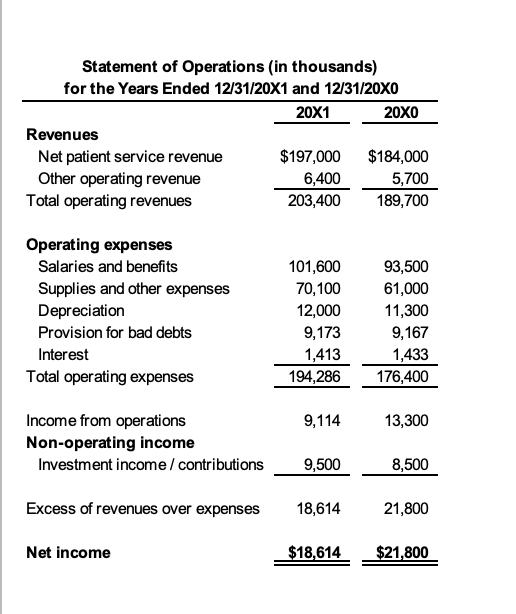
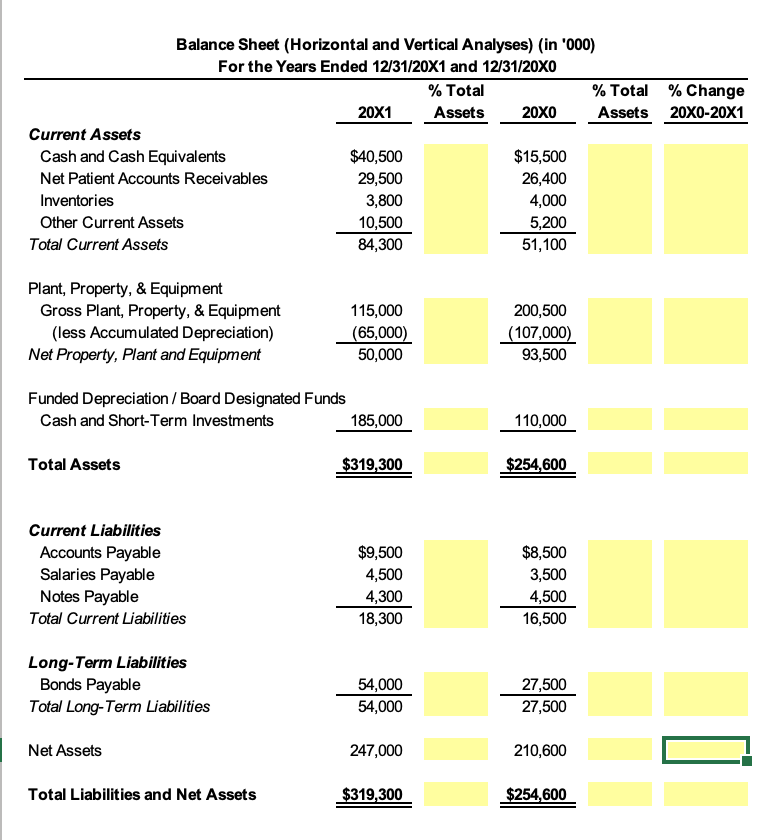
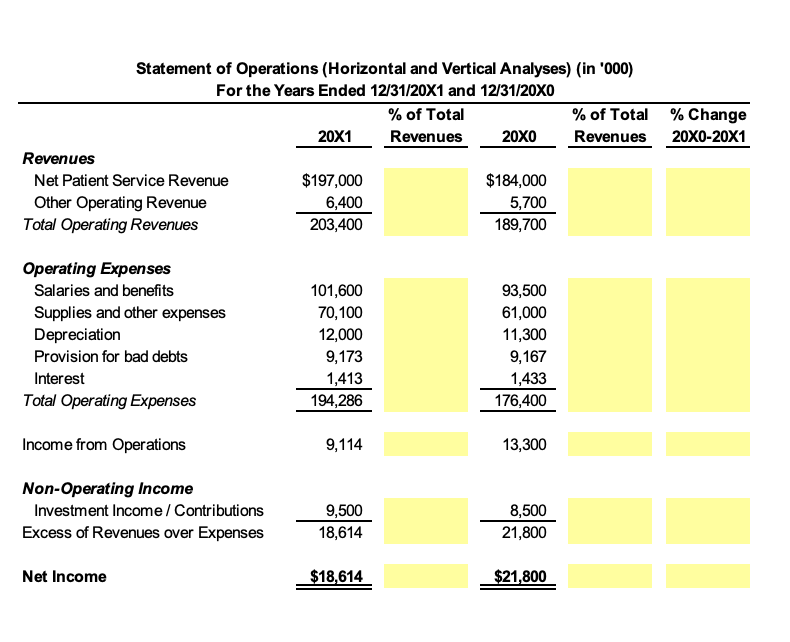
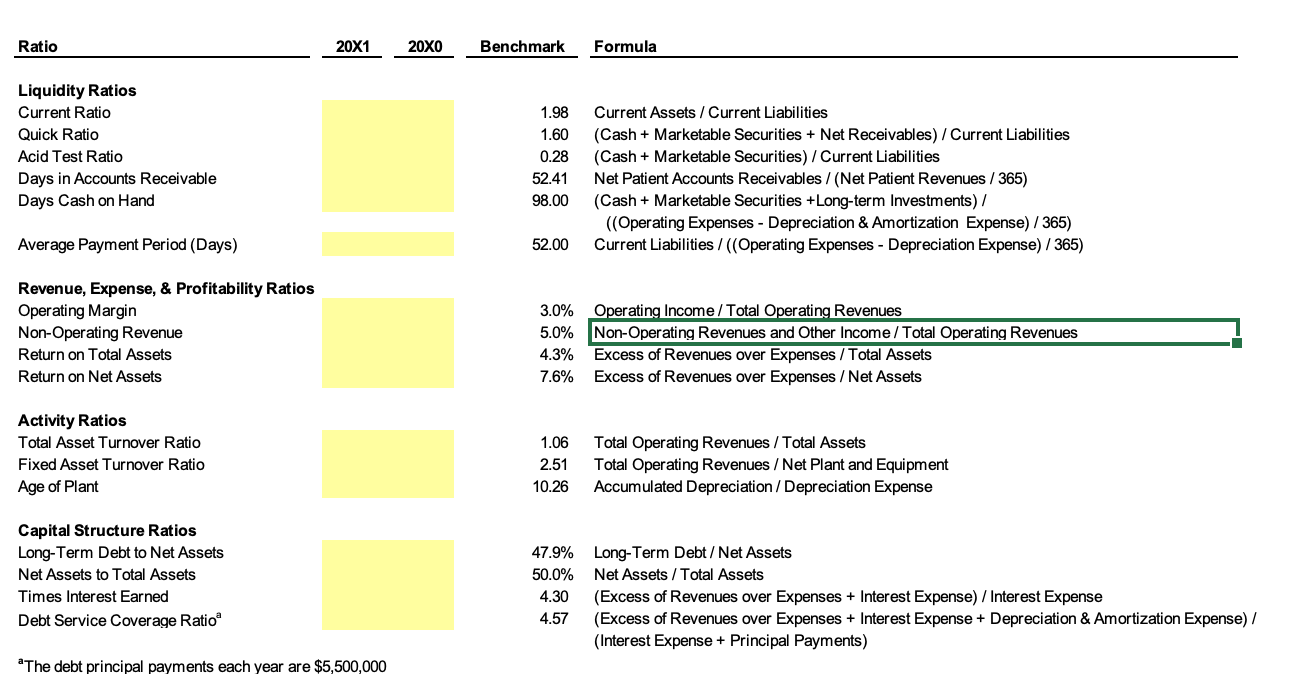
20X0 Balance Sheet (in thousands) for the Years Ended 12/31/20X1 and 12/31/20X0 20X1 Current assets Cash and cash equivalents $40,500 Net patient accounts receivables 29,500 Inventories 3,800 Other current assets 10.500 Total current assets 84,300 $15,500 26,400 4,000 5.200 51,100 Plant, property, and equipment Gross plant, property, and equipment (Less accumulated depreciation) Net property, plant and equipment 115,000 200,500 (65,000) (107,000) 50,000 93,500 Funded depreciation / board designated funds Cash and short-term investments 185,000 110,000 Total assets $319,300 $254,600 Current liabilities Accounts payable Salaries payable Notes payable Total current liabilities $9,500 4,500 4,300 18,300 $8,500 3,500 4,500 16,500 Long-term liabilities Bonds payable Total long-term liabilities 54,000 54,000 27,500 27,500 Net assets 247,000 210,600 Total liabilities and net assets $319,300 $254,600 Statement of Operations in thousands) for the Years Ended 12/31/20X1 and 12/31/20X0 20X1 20X0 Revenues Net patient service revenue $197,000 $184,000 Other operating revenue 6,400 5,700 Total operating revenues 203,400 189,700 Operating expenses Salaries and benefits Supplies and other expenses Depreciation Provision for bad debts Interest Total operating expenses 101,600 70,100 12,000 9,173 1,413 194,286 93,500 61,000 11,300 9,167 1,433 176,400 9,114 13,300 Income from operations Non-operating income Investment income / contributions 9,500 8,500 Excess of revenues over expenses 18,614 21,800 Net income $18,614 $21,800 Balance Sheet (Horizontal and Vertical Analyses) (in '000) For the Years Ended 12/31/20X1 and 12/31/20x0 % Total % Total % Change 20X1 Assets 20x0 Assets 20X0-20X1 Current Assets Cash and Cash Equivalents $40,500 $15,500 Net Patient Accounts Receivables 29,500 26,400 Inventories 3,800 4,000 Other Current Assets 10,500 5,200 Total Current Assets 84,300 51,100 Plant, Property, & Equipment Gross Plant, Property, & Equipment (less Accumulated Depreciation) Net Property, Plant and Equipment 115,000 (65,000) 50,000 200,500 (107,000) 93,500 Funded Depreciation / Board Designated Funds Cash and Short-Term Investments 185,000 110,000 Total Assets $319,300 $254,600 Current Liabilities Accounts Payable Salaries Payable Notes Payable Total Current Liabilities $9,500 4,500 4,300 18,300 $8,500 3,500 4,500 16,500 Long-Term Liabilities Bonds Payable Total Long-Term Liabilities 54,000 54,000 27,500 27,500 Net Assets 247,000 210,600 Total Liabilities and Net Assets $319,300 $254,600 Statement of Operations (Horizontal and Vertical Analyses) (in '000) For the Years Ended 12/31/20X1 and 12/31/20X0 % of Total % of Total % Change 20X1 Revenues 20X0 Revenues 20X0-20X1 Revenues Net Patient Service Revenue $197,000 $184,000 Other Operating Revenue 6,400 5,700 Total Operating Revenues 203,400 189,700 Operating Expenses Salaries and benefits Supplies and other expenses Depreciation Provision for bad debts Interest Total Operating Expenses 101,600 70,100 12,000 9,173 1,413 194,286 93,500 61,000 11,300 9,167 1,433 176,400 Income from Operations 9,114 13,300 Non-Operating Income Investment Income / Contributions Excess of Revenues over Expenses 9,500 18,614 8,500 21,800 Net Income $18,614 $21,800 Ratio 20X1 20XO Benchmark Formula 1.98 Liquidity Ratios Current Ratio Quick Ratio Acid Test Ratio Days in Accounts Receivable Days Cash on Hand 1.60 0.28 52.41 98.00 Current Assets / Current Liabilities (Cash + Marketable Securities + Net Receivables) / Current Liabilities (Cash + Marketable Securities) / Current Liabilities Net Patient Accounts Receivables / (Net Patient Revenues/365) (Cash + Marketable Securities +Long-term Investments) / ((Operating Expenses - Depreciation & Amortization Expense) /365) Current Liabilities/((Operating Expenses - Depreciation Expense) / 365) Average Payment Period (Days) 52.00 Revenue, Expense, & Profitability Ratios Operating Margin Non-Operating Revenue Return on Total Assets Return on Net Assets 3.0% Operating Income / Total Operating Revenues 5.0% Non-Operating Revenues and Other Income / Total Operating Revenues 4.3% Excess of Revenues over Expenses/Total Assets 7.6% Excess of Revenues over Expenses / Net Assets Activity Ratios Total Asset Turnover Ratio Fixed Asset Turnover Ratio Age of Plant 1.06 2.51 10.26 Total Operating Revenues / Total Assets Total Operating Revenues / Net Plant and Equipment Accumulated Depreciation / Depreciation Expense Capital Structure Ratios Long-Term Debt to Net Assets Net Assets to Total Assets Times Interest Earned Debt Service Coverage Ratio 47.9% Long-Term Debt/Net Assets 50.0% Net Assets/Total Assets 4.30 (Excess of Revenues over Expenses + Interest Expense) / Interest Expense 4.57 (Excess of Revenues over Expenses + Interest Expense + Depreciation & Amortization Expense) / (Interest Expense + Principal Payments) *The debt principal payments each year are $5,500,000
Step by Step Solution
There are 3 Steps involved in it

Get step-by-step solutions from verified subject matter experts