

Question: Using the provided dataset (Kalamazoo Historical Temperatures) - analyze and design appropriate tables which would store this data. NOTES - The dataset is the averages
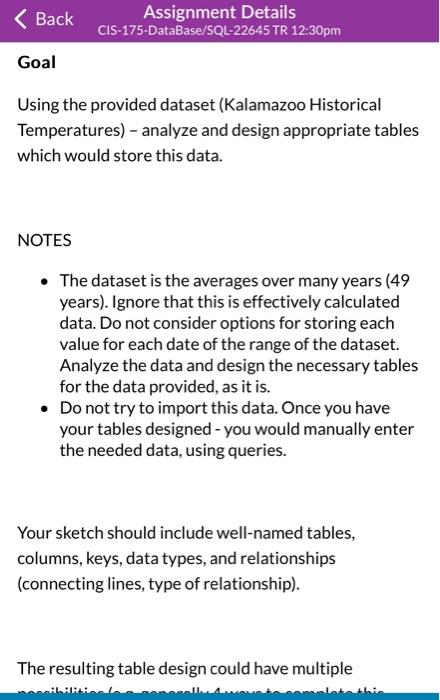

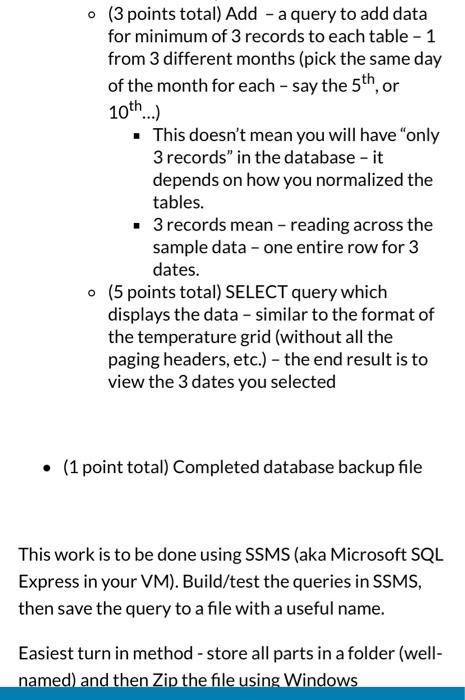
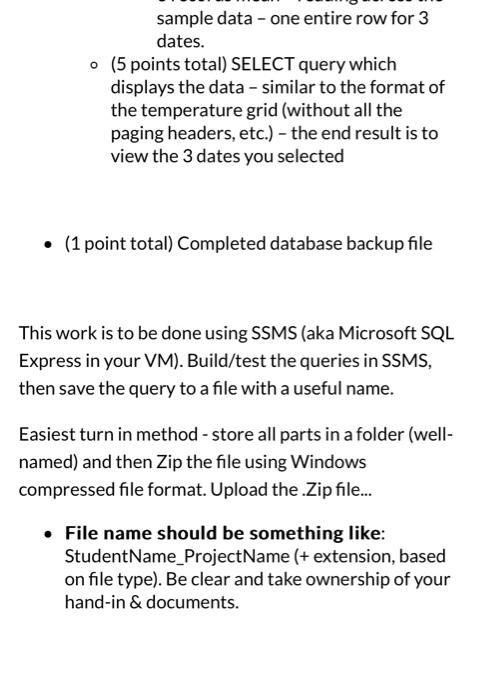
Using the provided dataset (Kalamazoo Historical Temperatures) - analyze and design appropriate tables which would store this data. NOTES - The dataset is the averages over many years (49 years). Ignore that this is effectively calculated data. Do not consider options for storing each value for each date of the range of the dataset. Analyze the data and design the necessary tables for the data provided, as it is. - Do not try to import this data. Once you have your tables designed - you would manually enter the needed data, using queries. Your sketch should include well-named tables, columns, keys, data types, and relationships (connecting lines, type of relationship). The resulting table design could have multiple The resulting table design could have multiple possibilities (e.g. generally 4 ways to complete this project - see grading below) - with the primary difference being the depth of normalization. Seek to be well-designed. Hand-ins (25pts total) - Sketch - worked on in-class: 10 points - Simple paper sketch (8 points), showing: - Show your analysis of the given data - Expected table layouts (table, columns, data types, and relationships) - Brainstorm participation: 2 points -- did you offer ideas (valid or not)? I will use the class session video to score this. - SQL Queries (students complete: 15 points for this work section) - (7 points total) Create - a query for each table (see chapter 3) - (3 points total) Add - a query to add data for minimum of 3 records to each table 1 from 3 different months (pick the same day - (3 points total) Add - a query to add data for minimum of 3 records to each table 1 from 3 different months (pick the same day of the month for each - say the 5th, or 10th) - This doesn't mean you will have "only 3 records" in the database - it depends on how you normalized the tables. - 3 records mean - reading across the sample data - one entire row for 3 dates. - (5 points total) SELECT query which displays the data - similar to the format of the temperature grid (without all the paging headers, etc.) - the end result is to view the 3 dates you selected - (1 point total) Completed database backup file This work is to be done using SSMS (aka Microsoft SQL Express in your VM). Build/test the queries in SSMS, then save the query to a file with a useful name. Easiest turn in method - store all parts in a folder (wellnamed) and then Zip the file using Windows sample data - one entire row for 3 dates. - (5 points total) SELECT query which displays the data - similar to the format of the temperature grid (without all the paging headers, etc.) - the end result is to view the 3 dates you selected - (1 point total) Completed database backup file This work is to be done using SSMS (aka Microsoft SQL Express in your VM). Build/test the queries in SSMS, then save the query to a file with a useful name. Easiest turn in method - store all parts in a folder (wellnamed) and then Zip the file using Windows compressed file format. Upload the .Zip file... - File name should be something like: StudentName_ProjectName (+ extension, based on file type). Be clear and take ownership of your hand-in \& documents
Step by Step Solution
There are 3 Steps involved in it

Get step-by-step solutions from verified subject matter experts