

Question: Using the psychrometric chart, Fig. A-9, determine (a) the relative humidity, the humidity ratio, and the specific enthalpy of the mixture, in kJ per
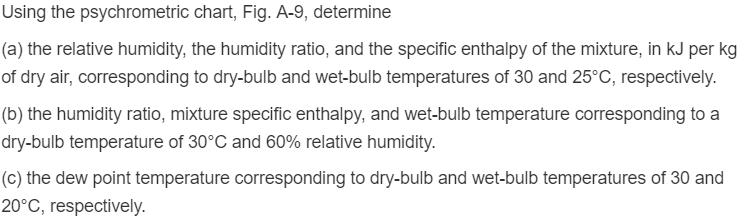
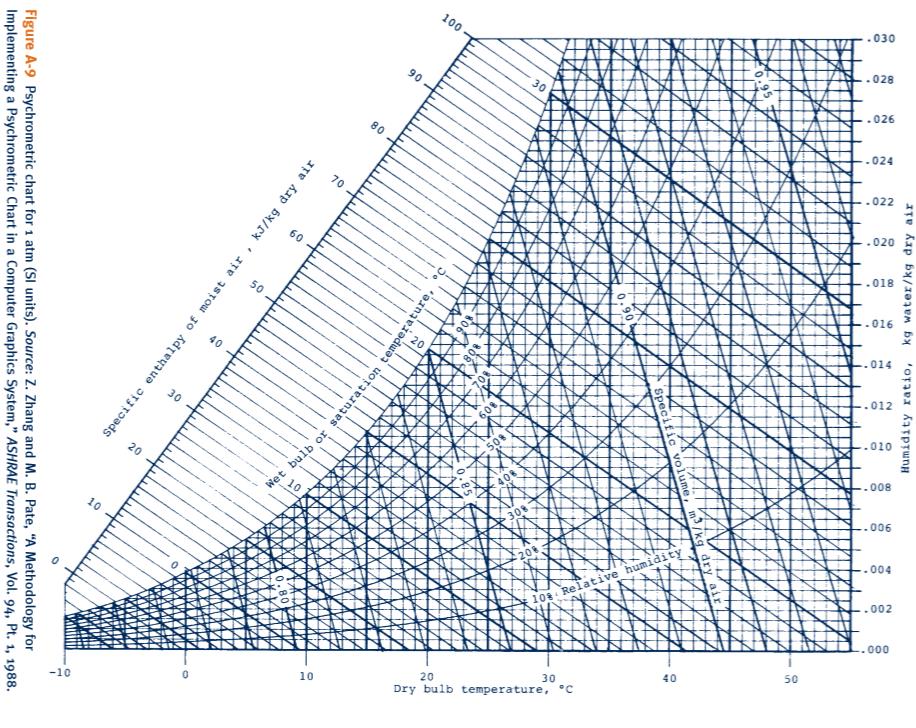
Using the psychrometric chart, Fig. A-9, determine (a) the relative humidity, the humidity ratio, and the specific enthalpy of the mixture, in kJ per kg of dry air, corresponding to dry-bulb and wet-bulb temperatures of 30 and 25C, respectively. (b) the humidity ratio, mixture specific enthalpy, and wet-bulb temperature corresponding to a dry-bulb temperature of 30C and 60% relative humidity. (c) the dew point temperature corresponding to dry-bulb and wet-bulb temperatures of 30 and 20C, respectively. Figure A-9 Psychrometric chart for 1 atm (Sl units). Source: Z. Zhang and M. B. Pate, "A Methodology for Implementing a Psychrometric Chart in a Computer Graphics System," ASHRAE Transactions, Vol. 94, Pt. 1, 1988. kJ/kg dry air 70 . Specific enthalpy of moist air 30 08 06 100 30 a bulb or saturation temperatu 10. 2 2 .80 90% 0.85 Specific volume, m3/kg dry air 10 20 30 40 50 Dry bulb temperature, C .030 .028 .026 -024 .022 .020 .018 910- Humidity ratio, kg water/kg dry air .008 900 - -004 .002 .000
Step by Step Solution
There are 3 Steps involved in it

Get step-by-step solutions from verified subject matter experts