

Question: Using the ratio analysis template listed in the test instructions, complete the financial analysis of Yum Brands for the two most recent years. Access Yahoo
Using the ratio analysis template listed in the test instructions, complete the financial analysis of Yum Brands for the two most recent years.
Access Yahoo Finance, enter YUM in stock symbol field, Scroll to "Financials" to select financial statements. For each statement, select "Expand All" in top right corner of statement, to view detailed information. Complete the analysis spreadsheet
Using the space below, analyze the company using the two years of data and reference the industry averages in the following areas:
Staying Power
Earning Power
Overall efficiency ratios
Working capital cycle ratios
Use the CSImarket.com website, listed in the instructions, to look up industry averages (Go to site, enter stock symbol, select Fundamentals. Use Industry column to retrieve data for all ratios except Earnings Quality and Accounts Payable turnover). Use TTM industry data. Enter the data in the analysis spreadsheet.
Submit the spreadsheet via question # 24 below.
Complete the analysis in the space below.
https://csimarket.com/
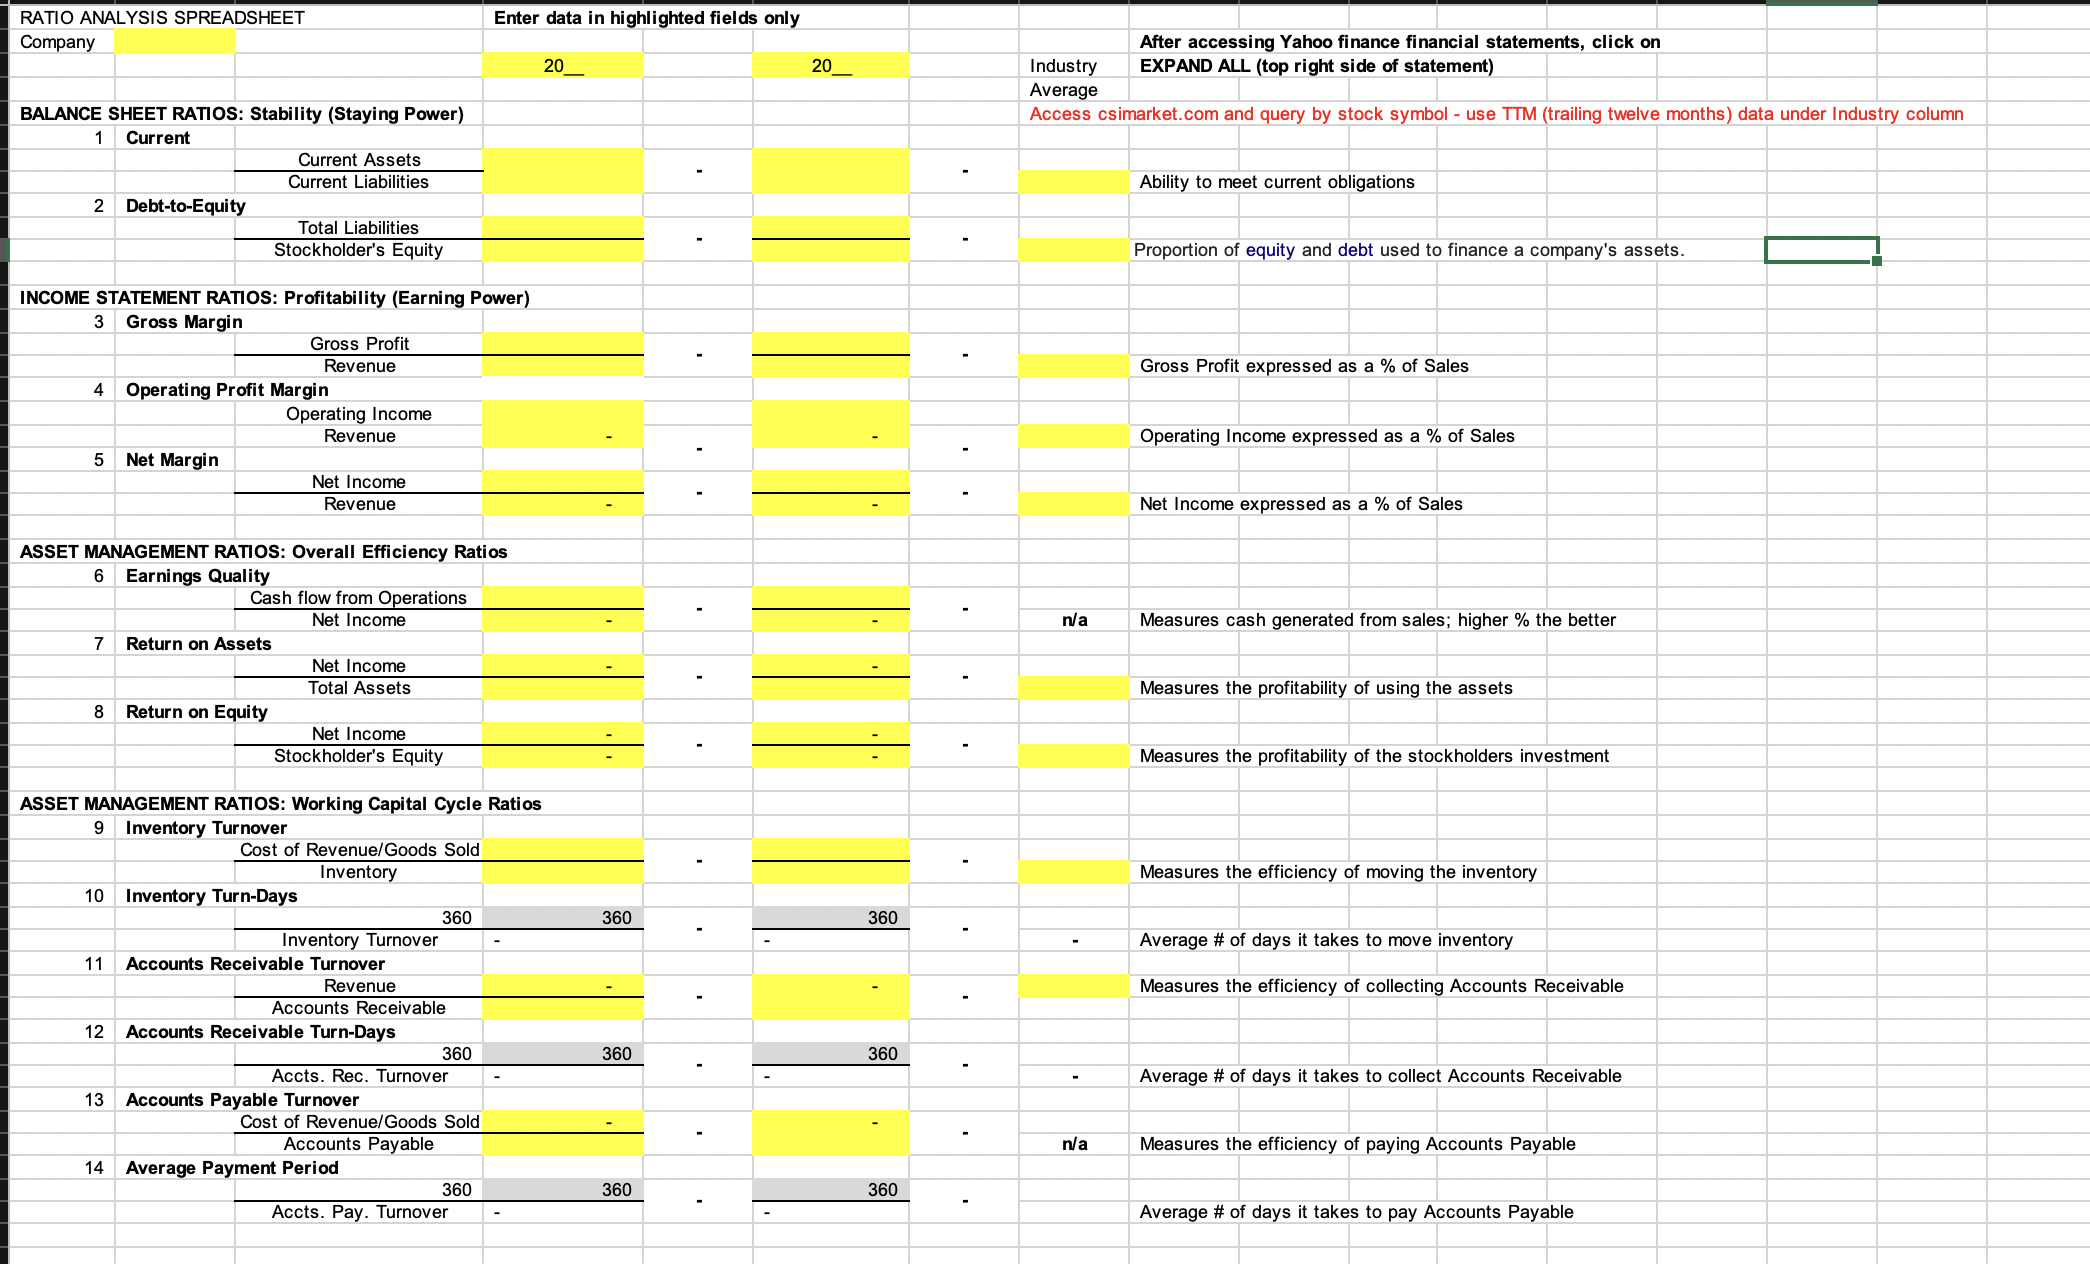
RATIO ANALYSIS SPREADSHEET Enter data in highlighted fields only Company After accessing Yahoo finance financial statements, click on 20 20 Industry EXPAND ALL (top right side of statement) Average BALANCE SHEET RATIOS: Stability (Staying Power) Access csimarket.com and query by stock symbol - use TIM (trailing twelve months) data under Industry column 1 Current Current Assets Current Liabilities Ability to meet current obligations 2 Debt-to-Equity Total Liabilities Stockholder's Equity Proportion of equity and debt used to finance a company's assets. INCOME STATEMENT RATIOS: Profitability (Earning Power) 3 Gross Margin Gross Profit Revenue Gross Profit expressed as a % of Sales 4 Operating Profit Margin Operating Income Revenue Operating Income expressed as a % of Sales 5 Net Margin Net Income Revenue Net Income expressed as a % of Sales ASSET MANAGEMENT RATIOS: Overall Efficiency Ratios 6 Earnings Quality Cash flow from Operations Net Income n/a Measures cash generated from sales; higher % the better Return on Assets Net Income Total Assets Measures the profitability of using the assets 8 Return on Equity Net Income Stockholder's Equity Measures the profitability of the stockholders investment ASSET MANAGEMENT RATIOS: Working Capital Cycle Ratios 9 Inventory Turnover Cost of Revenue/Goods Sold Inventory Measures the efficiency of moving the inventory 10 Inventory Turn-Days 360 360 360 Inventory Turnover Average # of days it takes to move inventory 11 Accounts Receivable Turnover Revenue Measures the efficiency of collecting Accounts Receivable Accounts Receivable 12 Accounts Receivable Turn-Days 360 360 360 Accts. Rec. Turnover Average # of days it takes to collect Accounts Receivable 13 Accounts Payable Turnover Cost of Revenue/Goods Sold Accounts Payable n/a Measures the efficiency of paying Accounts Payable 14 Average Payment Period 360 360 360 Accts. Pay. Turnover Average # of days it takes to pay Accounts Payable
Step by Step Solution
There are 3 Steps involved in it

Get step-by-step solutions from verified subject matter experts