

Question: Using the relevant ratios from the attached schedules, please answer the following questions. To do this you should consider the 3-year trend, i.e. improving, declining,
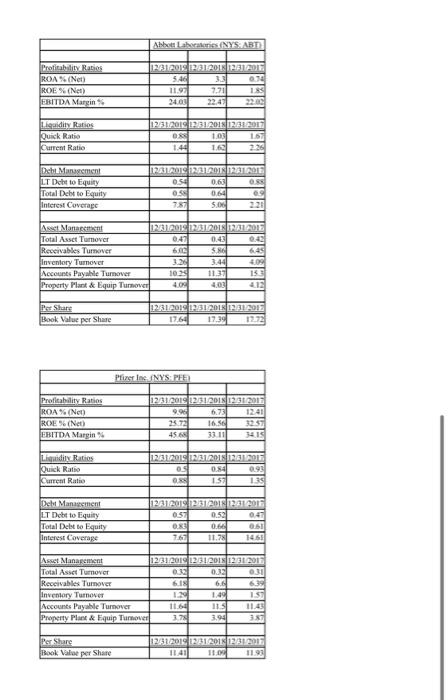
Abbott Laboratories (NYS. ABT Profitability Ratios ROA(Net) ROE% (Net) EBITDA Margins 123120 121 122 12015 5.46 3.31 14 119 7.71 2400 22.41 Lidity Ratins Quick Ratio Current Ratio 12:3120151231.2018 12:312011 O 1.03 167 1.44 2.25 Debt Management LT Dcht to Equity Total Debt to Equity Interest Coverage 123LROTS 123RDIN 123RDIE 0.5 0.63 OSA 0.64 7871 5. Asset Management 1231.POTE 1231POISIRALADIE Total Asset Turnover 0.41 0.43 0.40 Receivables Tumover 6.00 S.NO Inventory Turnovet 3.24 40 Accounts Payable Turnover 1025 11.37 15 Property Plant & Equip Turnover 404 4,03 Pe Share Book Value per Share 1231201 1251201 12312 17.39 Pfizer Inc. INYS PER Profitability Ratios ROA% (Net ROE (Net) EBITDA Margin 1231.2018 12:31 2018 12:31 2015 9.90 6.73 12:41 25.73 16.30 456 3311 Liquidity Ratios Quick Ratio Current Ratio 123123120180125 OS 0.84 0.93 0. 1.57 135 Delut Management LT Debt to Equity Total Debt to Equity Interest Coverage 1201 PUS12312S1P 05 0.53 0.41 08 0.66 0151 7.67 11.78 14.55 Asset Management 1231201 1201.2018 123.2017 Total Asset Turnover 033 0.33 031 Receivables Turnover 6.18 6.6 634 Inventory Turnover IN 1.49 1ST Accounts Payable Turnover 11.60 11 11.45 Property Plant & Equip Tunhoved 3.74 3.94 387 Per Share Book Vale per Share 122.51 2015 1201.2018 12:31.2017 11.40 11. 11.90
Step by Step Solution
There are 3 Steps involved in it

Get step-by-step solutions from verified subject matter experts