

Question: Using the retirement simulation spreadsheet that we created in class (based on file, Retirement planning sim template, posted on Canvas), set the savings rate to
Using the retirement simulation spreadsheet that we created in class (based on file, Retirement planning sim template, posted on Canvas), set the savings rate to 12.5% (instead of the 10% default value in the original simulation). Simulate 200 30-year careers. What percent of the time will the investment portfolio be worth more than $1,100,000? What is the probability that the portfolio will be worth less than $750,000?
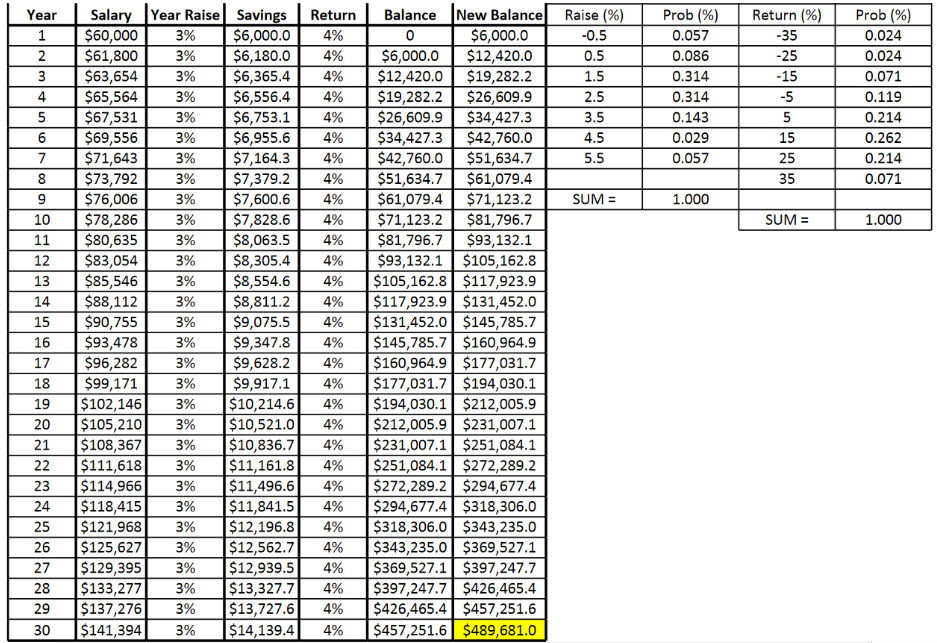
Return 4% 4% Year 1 2 3 4 5 6 7 8 3% 3% Raise (%) -0.5 0.5 1.5 2.5 3.5 4.5 5.5 Prob (%) 0.057 0.086 0.314 0.314 0.143 0.029 0.057 Return (%) -35 -25 -15 -5 5 15 25 35 Prob (%) 0.024 0.024 0.071 0.119 0.214 0.262 0.214 0.071 SUM= 1.000 SUM= 1.000 Salary Year Raise Savings $60,000 3% $6,000.0 $61,800 3% $6,180.0 $63,654 $6,365.4 $65,564 $6,556.4 $67,531 3% $6,753.1 $69,556 3% $6,955.6 $71,643 3% $7,164.3 $73,792 3% $7,379.2 $76,006 3% $7,600.6 $78,286 3% $7,828.6 $80,635 3% $8,063.5 $83,054 3% $8,305.4 $85,546 3% $8,554.6 $88,112 3% $8,811.2 $90,755 $9,075.5 $93,478 $9,347.8 $96,282 3% $9,628.2 $99,171 3% $9,917.1 $102,146 3% $10,214.6 $105,210 3% $10,521.0 $108,367 3% $10,836.7 $111,618 3% $11,161.8 $114,966 3% $11,496.6 $118,415 3% $11,841.5 $121,968 3% $12,196.8 $125,627 3% $12,562.7 $129,395 3% $12,939.5 $133,277 3% $13,327.7 $137,276 3% $13,727.6 $141,394 3% $14,139.4 9 10 11 12 13 14 15 16 17 18 19 20 21 22 23 24 25 26 27 3% 3% 4% 4% 4% 4% 4% 4% 4% 4% 4% 4% 4% 4% 4% 4% 4% 4% 4% 4% 4% 4% 4% 4% 4% 4% 4% 4% 4% 4% Balance New Balance 0 $6,000.0 $6,000.0 $12,420.0 $12,420.0 $19,282.2 $19,282.2 $26,609.9 $26,609.9 $34,427.3 $34,427.3 $42,760.0 $42,760.0 $51,634.7 $51,634.7 $61,079.4 $61,079.4 $71,123.2 $71,123.2 $81,796.7 $81,796.7 $93,132.1 $93,132.1 $105,162.8 $105,162.8 $117,923.9 $117,923.9 $131,452.0 $131,452.0 $145,785.7 $145,785.7 $160,964.9 $160,964.9 $177,031.7 $177,031.7 $194,030.1 $194,030.1 $212,005.9 $212,005.9 $231,007.1 $231,007.1 $251,084.1 $251,084.1 $272,289.2 $272,289.2 $294,677.4 $294,677.4 $318,306.0 $318,306.0 $343,235.0 $343,235.0 $369,527.1 $369,527.1 $397,247.7 $397,247.7 $426,465.4 $426,465.4 $457,251.6 $457,251.6 $489,681.0 28 29 30 Return 4% 4% Year 1 2 3 4 5 6 7 8 3% 3% Raise (%) -0.5 0.5 1.5 2.5 3.5 4.5 5.5 Prob (%) 0.057 0.086 0.314 0.314 0.143 0.029 0.057 Return (%) -35 -25 -15 -5 5 15 25 35 Prob (%) 0.024 0.024 0.071 0.119 0.214 0.262 0.214 0.071 SUM= 1.000 SUM= 1.000 Salary Year Raise Savings $60,000 3% $6,000.0 $61,800 3% $6,180.0 $63,654 $6,365.4 $65,564 $6,556.4 $67,531 3% $6,753.1 $69,556 3% $6,955.6 $71,643 3% $7,164.3 $73,792 3% $7,379.2 $76,006 3% $7,600.6 $78,286 3% $7,828.6 $80,635 3% $8,063.5 $83,054 3% $8,305.4 $85,546 3% $8,554.6 $88,112 3% $8,811.2 $90,755 $9,075.5 $93,478 $9,347.8 $96,282 3% $9,628.2 $99,171 3% $9,917.1 $102,146 3% $10,214.6 $105,210 3% $10,521.0 $108,367 3% $10,836.7 $111,618 3% $11,161.8 $114,966 3% $11,496.6 $118,415 3% $11,841.5 $121,968 3% $12,196.8 $125,627 3% $12,562.7 $129,395 3% $12,939.5 $133,277 3% $13,327.7 $137,276 3% $13,727.6 $141,394 3% $14,139.4 9 10 11 12 13 14 15 16 17 18 19 20 21 22 23 24 25 26 27 3% 3% 4% 4% 4% 4% 4% 4% 4% 4% 4% 4% 4% 4% 4% 4% 4% 4% 4% 4% 4% 4% 4% 4% 4% 4% 4% 4% 4% 4% Balance New Balance 0 $6,000.0 $6,000.0 $12,420.0 $12,420.0 $19,282.2 $19,282.2 $26,609.9 $26,609.9 $34,427.3 $34,427.3 $42,760.0 $42,760.0 $51,634.7 $51,634.7 $61,079.4 $61,079.4 $71,123.2 $71,123.2 $81,796.7 $81,796.7 $93,132.1 $93,132.1 $105,162.8 $105,162.8 $117,923.9 $117,923.9 $131,452.0 $131,452.0 $145,785.7 $145,785.7 $160,964.9 $160,964.9 $177,031.7 $177,031.7 $194,030.1 $194,030.1 $212,005.9 $212,005.9 $231,007.1 $231,007.1 $251,084.1 $251,084.1 $272,289.2 $272,289.2 $294,677.4 $294,677.4 $318,306.0 $318,306.0 $343,235.0 $343,235.0 $369,527.1 $369,527.1 $397,247.7 $397,247.7 $426,465.4 $426,465.4 $457,251.6 $457,251.6 $489,681.0 28 29 30
Step by Step Solution
There are 3 Steps involved in it

Get step-by-step solutions from verified subject matter experts