

Question: Using the rules for interpreting run charts, analyze the chart provided on rates of Clostridium Difficile Infection (CDI) in a hospital that implemented an electronic
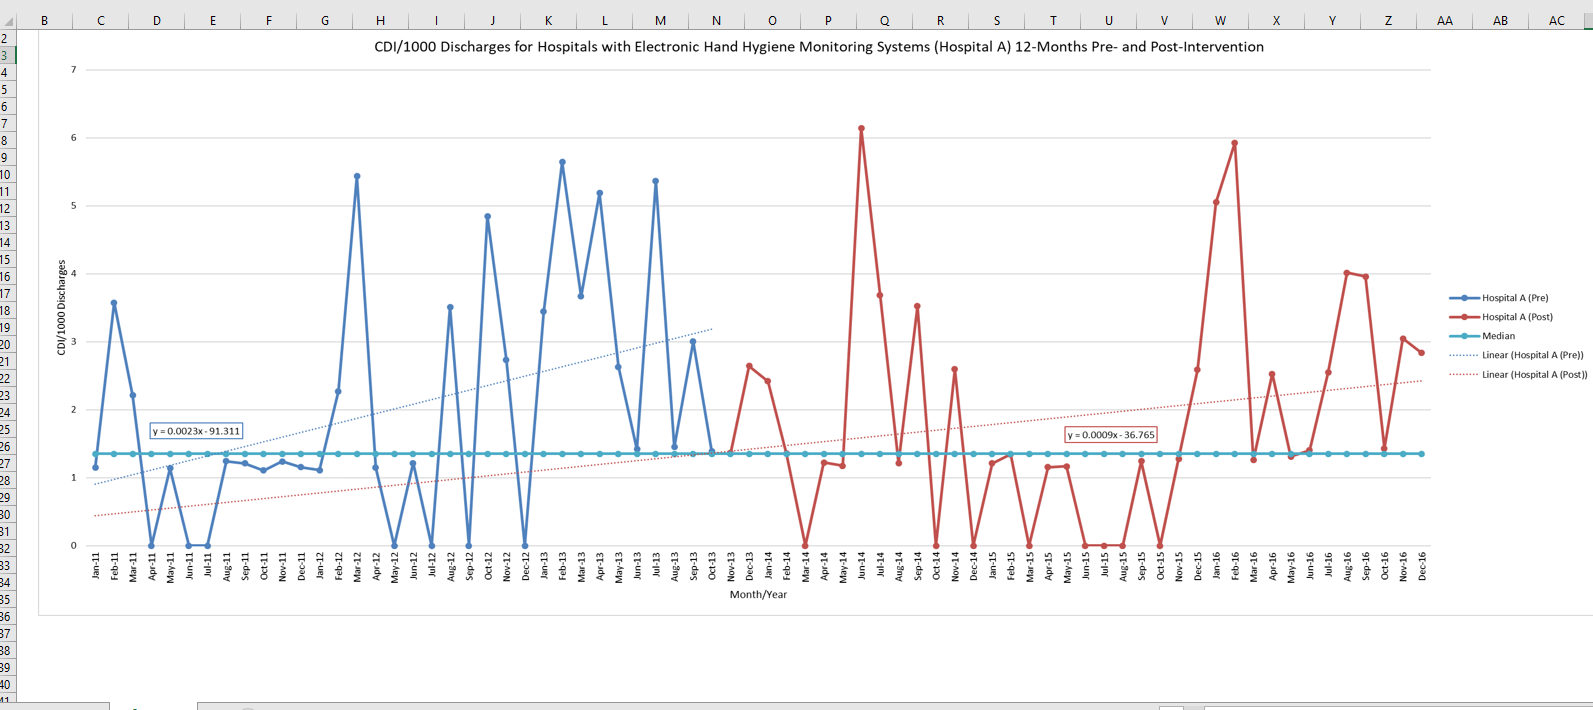 Using the rules for interpreting run charts, analyze the chart provided on rates of Clostridium Difficile Infection (CDI) in a hospital that implemented an electronic hand hygiene monitoring system (EHHMS) to improve hand hygiene rates. The hospital began more closely monitoring hand hygiene activity at the beginning of the "intervention" period, and the EHHMS was piloted in September 2014 and fully implemented in November 2014. Apply the run chart rules to interpret what's happening over the full pre- and post-timeline (full 6 years). Would you say this process is in control (think about what we'd expect the graph of an in-control process to look like), or do we have some statistically unlikely patterns (indicating special cause variation)? Is that a good or bad thing (in this case)?
Step by Step Solution
There are 3 Steps involved in it

Get step-by-step solutions from verified subject matter experts