

Question: Using the same data as for Problem 2 3 , calculate the expected return and the volatility ( standard deviation ) of a portfolio consisting
Using the same data as for Problem calculate the expected return and the volatility standard deviation of a portfolio consisting of Johnson & Johnsons and Walgreens stocks using a wide range of portfolio weights. Plot the expected return as a function of the portfolio volatility.
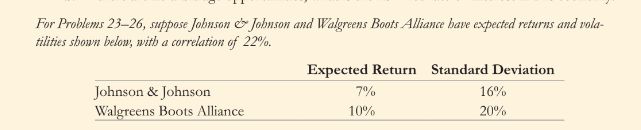
Using your graph, identify the range of Johnson & Johnsons portfolio weights that yield eficient combinations of the two stocks, rounded to the nearest percentage point.For Problems suppose Jobnson & Johnson and Walgreens Boots. Alliance have expected returns and volatilities shown below, with a correlation of
Step by Step Solution
There are 3 Steps involved in it
1 Expert Approved Answer
Step: 1 Unlock

Question Has Been Solved by an Expert!
Get step-by-step solutions from verified subject matter experts
Step: 2 Unlock
Step: 3 Unlock