

Question: Using the sample data, compute by hand Pearson's correlation between the poverty rate (X) and murder rate (Y) for US states and then test the
Using the sample data, compute by hand Pearson's correlation between the poverty rate (X) and murder rate (Y) for US states and then test the null hypothesis that the correlation in the population equals 0 (? = 0). Interpret results.
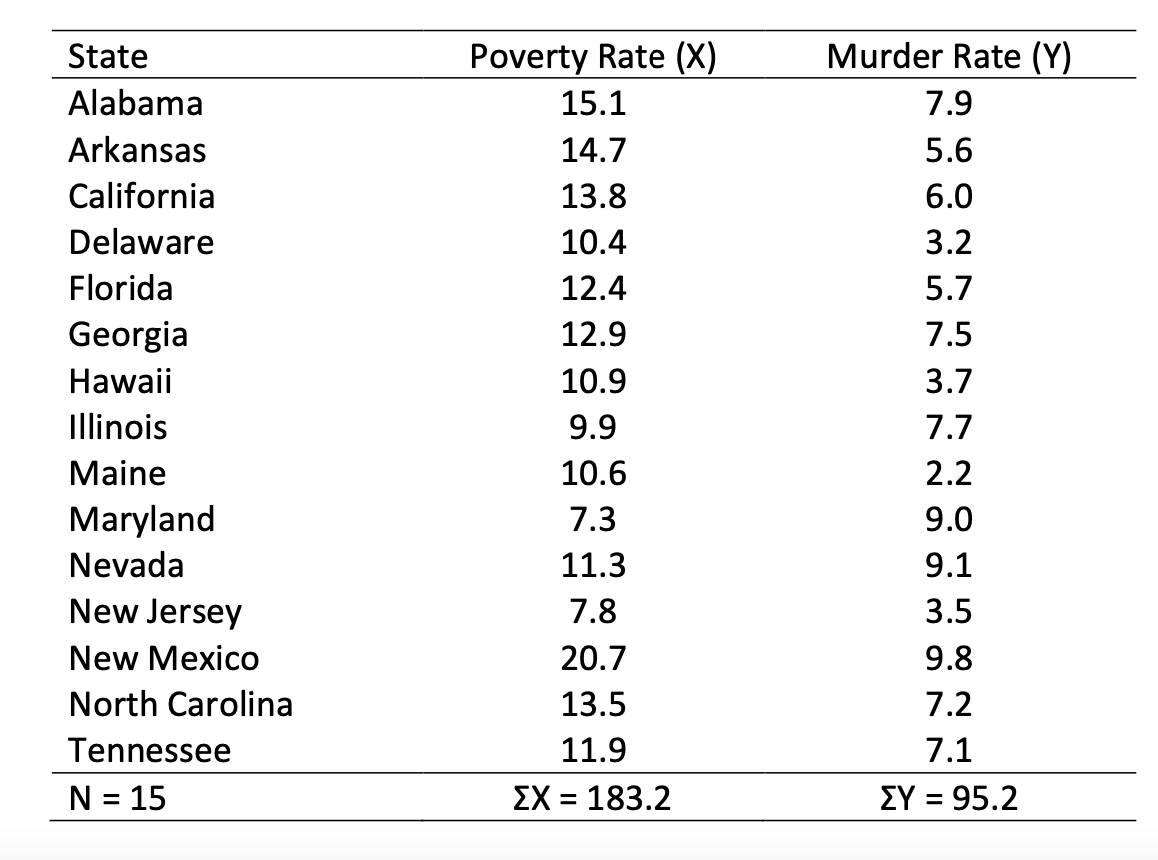
State Poverty Rate (X) Murder Rate (Y) Alabama 15.1 7.9 Arkansas 14.7 5.6 California 13.8 6.0 Delaware 10.4 3.2 Florida 12.4 5.7 Georgia 12.9 7.5 Hawaii 10.9 3.7 Illinois 9.9 7.7 Maine 10.6 2.2 Maryland 7.3 9.0 Nevada 11.3 9.1 New Jersey 7.8 3.5 New Mexico 20.7 9.8 North Carolina 13.5 7.2 Tennessee 11.9 7.1 N = 15 EX = 183.2 EY = 95.2
Step by Step Solution
There are 3 Steps involved in it
1 Expert Approved Answer
Step: 1 Unlock

Question Has Been Solved by an Expert!
Get step-by-step solutions from verified subject matter experts
Step: 2 Unlock
Step: 3 Unlock