

Question: Using the sample data from the accompanying table, complete parts (a) an Data Table Click the icon to view the data table. below. Full data
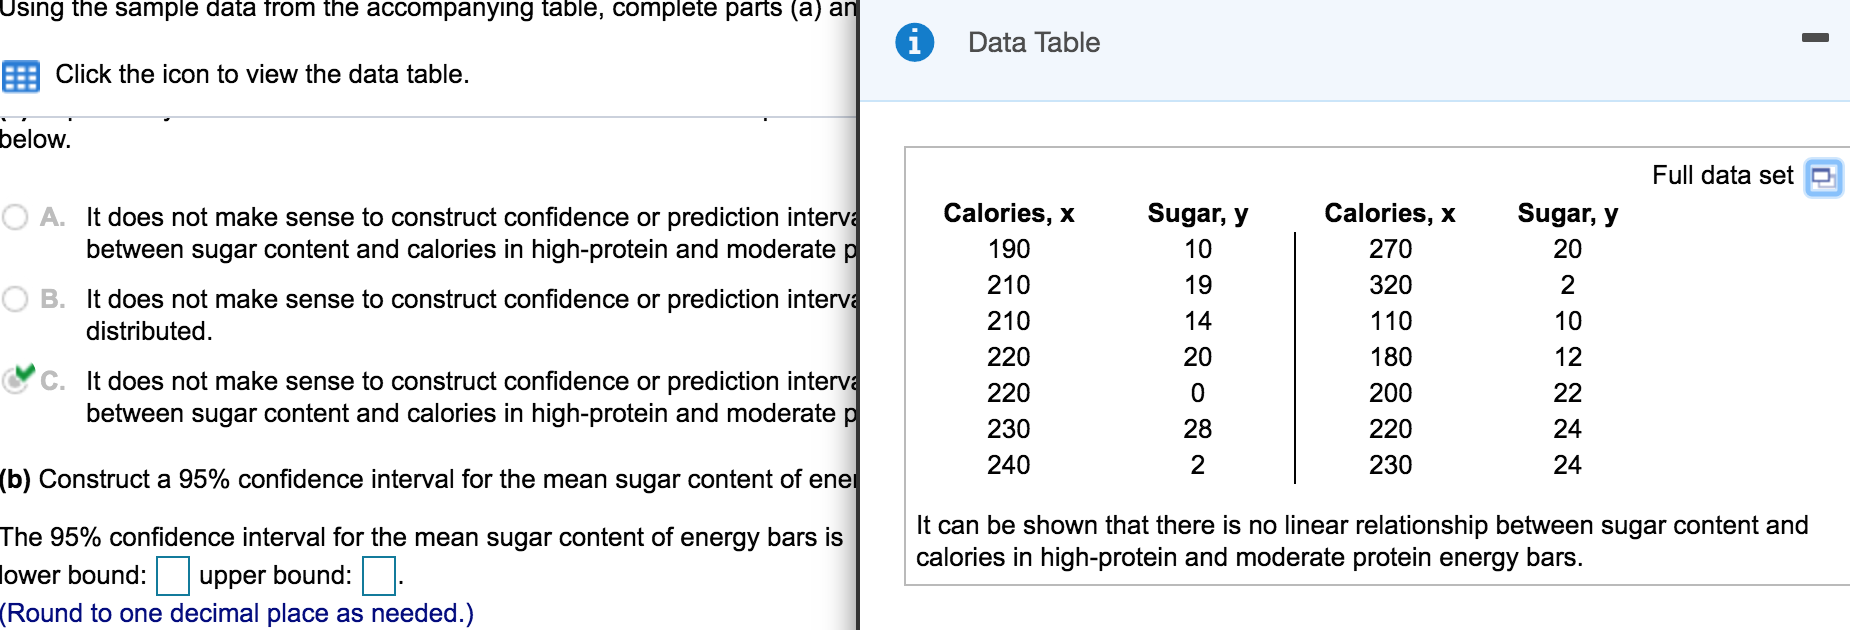
Using the sample data from the accompanying table, complete parts (a) an Data Table Click the icon to view the data table. below. Full data set O A. It does not make sense to construct confidence or prediction interva Calories, X Sugar, y Calories, X Sugar, y between sugar content and calories in high-protein and moderate p 190 10 270 20 O B. It does not make sense to construct confidence or prediction interva 210 19 320 2 distributed. 210 14 110 10 C. It does not make sense to construct confidence or prediction interva 220 20 180 12 between sugar content and calories in high-protein and moderate p 220 0 200 22 230 28 220 24 (b) Construct a 95% confidence interval for the mean sugar content of ener 240 2 230 24 The 95% confidence interval for the mean sugar content of energy bars is It can be shown that there is no linear relationship between sugar content and ower bound: upper bound: calories in high-protein and moderate protein energy bars. Round to one decimal place as needed.)
Step by Step Solution
There are 3 Steps involved in it

Get step-by-step solutions from verified subject matter experts