

Question: Using the sample data provided to you, please do the following, and make sure to provide explanations (e.g. details of calculations) for each answer: 1.
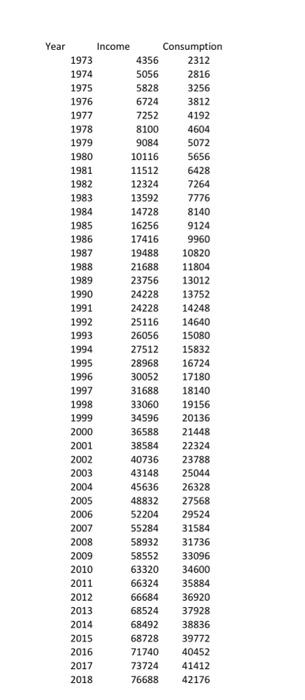
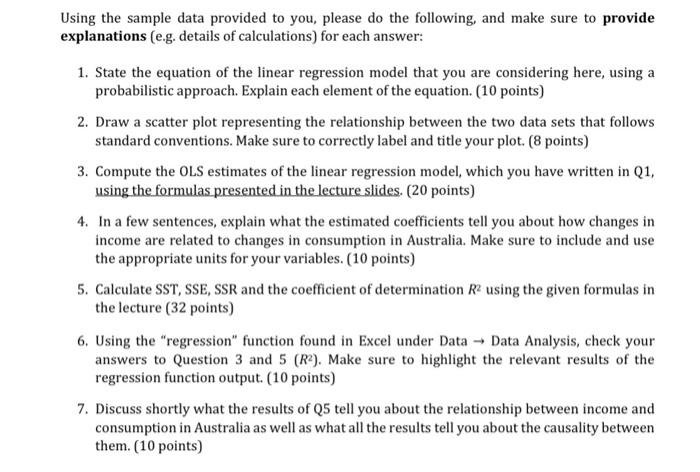
Using the sample data provided to you, please do the following, and make sure to provide explanations (e.g. details of calculations) for each answer: 1. State the equation of the linear regression model that you are considering here, using a probabilistic approach. Explain each element of the equation. ( 10 points) 2. Draw a scatter plot representing the relationship between the two data sets that follows standard conventions. Make sure to correctly label and title your plot. ( 8 points) 3. Compute the OLS estimates of the linear regression model, which you have written in Q1, using the formulas presented in the lecture slides. ( 20 points) 4. In a few sentences, explain what the estimated coefficients tell you about how changes in income are related to changes in consumption in Australia. Make sure to include and use the appropriate units for your variables. ( 10 points) 5. Calculate SST, SSE, SSR and the coefficient of determination R2 using the given formulas in the lecture (32 points) 6. Using the "regression" function found in Excel under Data Data Analysis, check your answers to Question 3 and 5(R2). Make sure to highlight the relevant results of the regression function output. ( 10 points) 7. Discuss shortly what the results of Q5 tell you about the relationship between income and consumption in Australia as well as what all the results tell you about the causality between them. (10 points)
Step by Step Solution
There are 3 Steps involved in it

Get step-by-step solutions from verified subject matter experts