

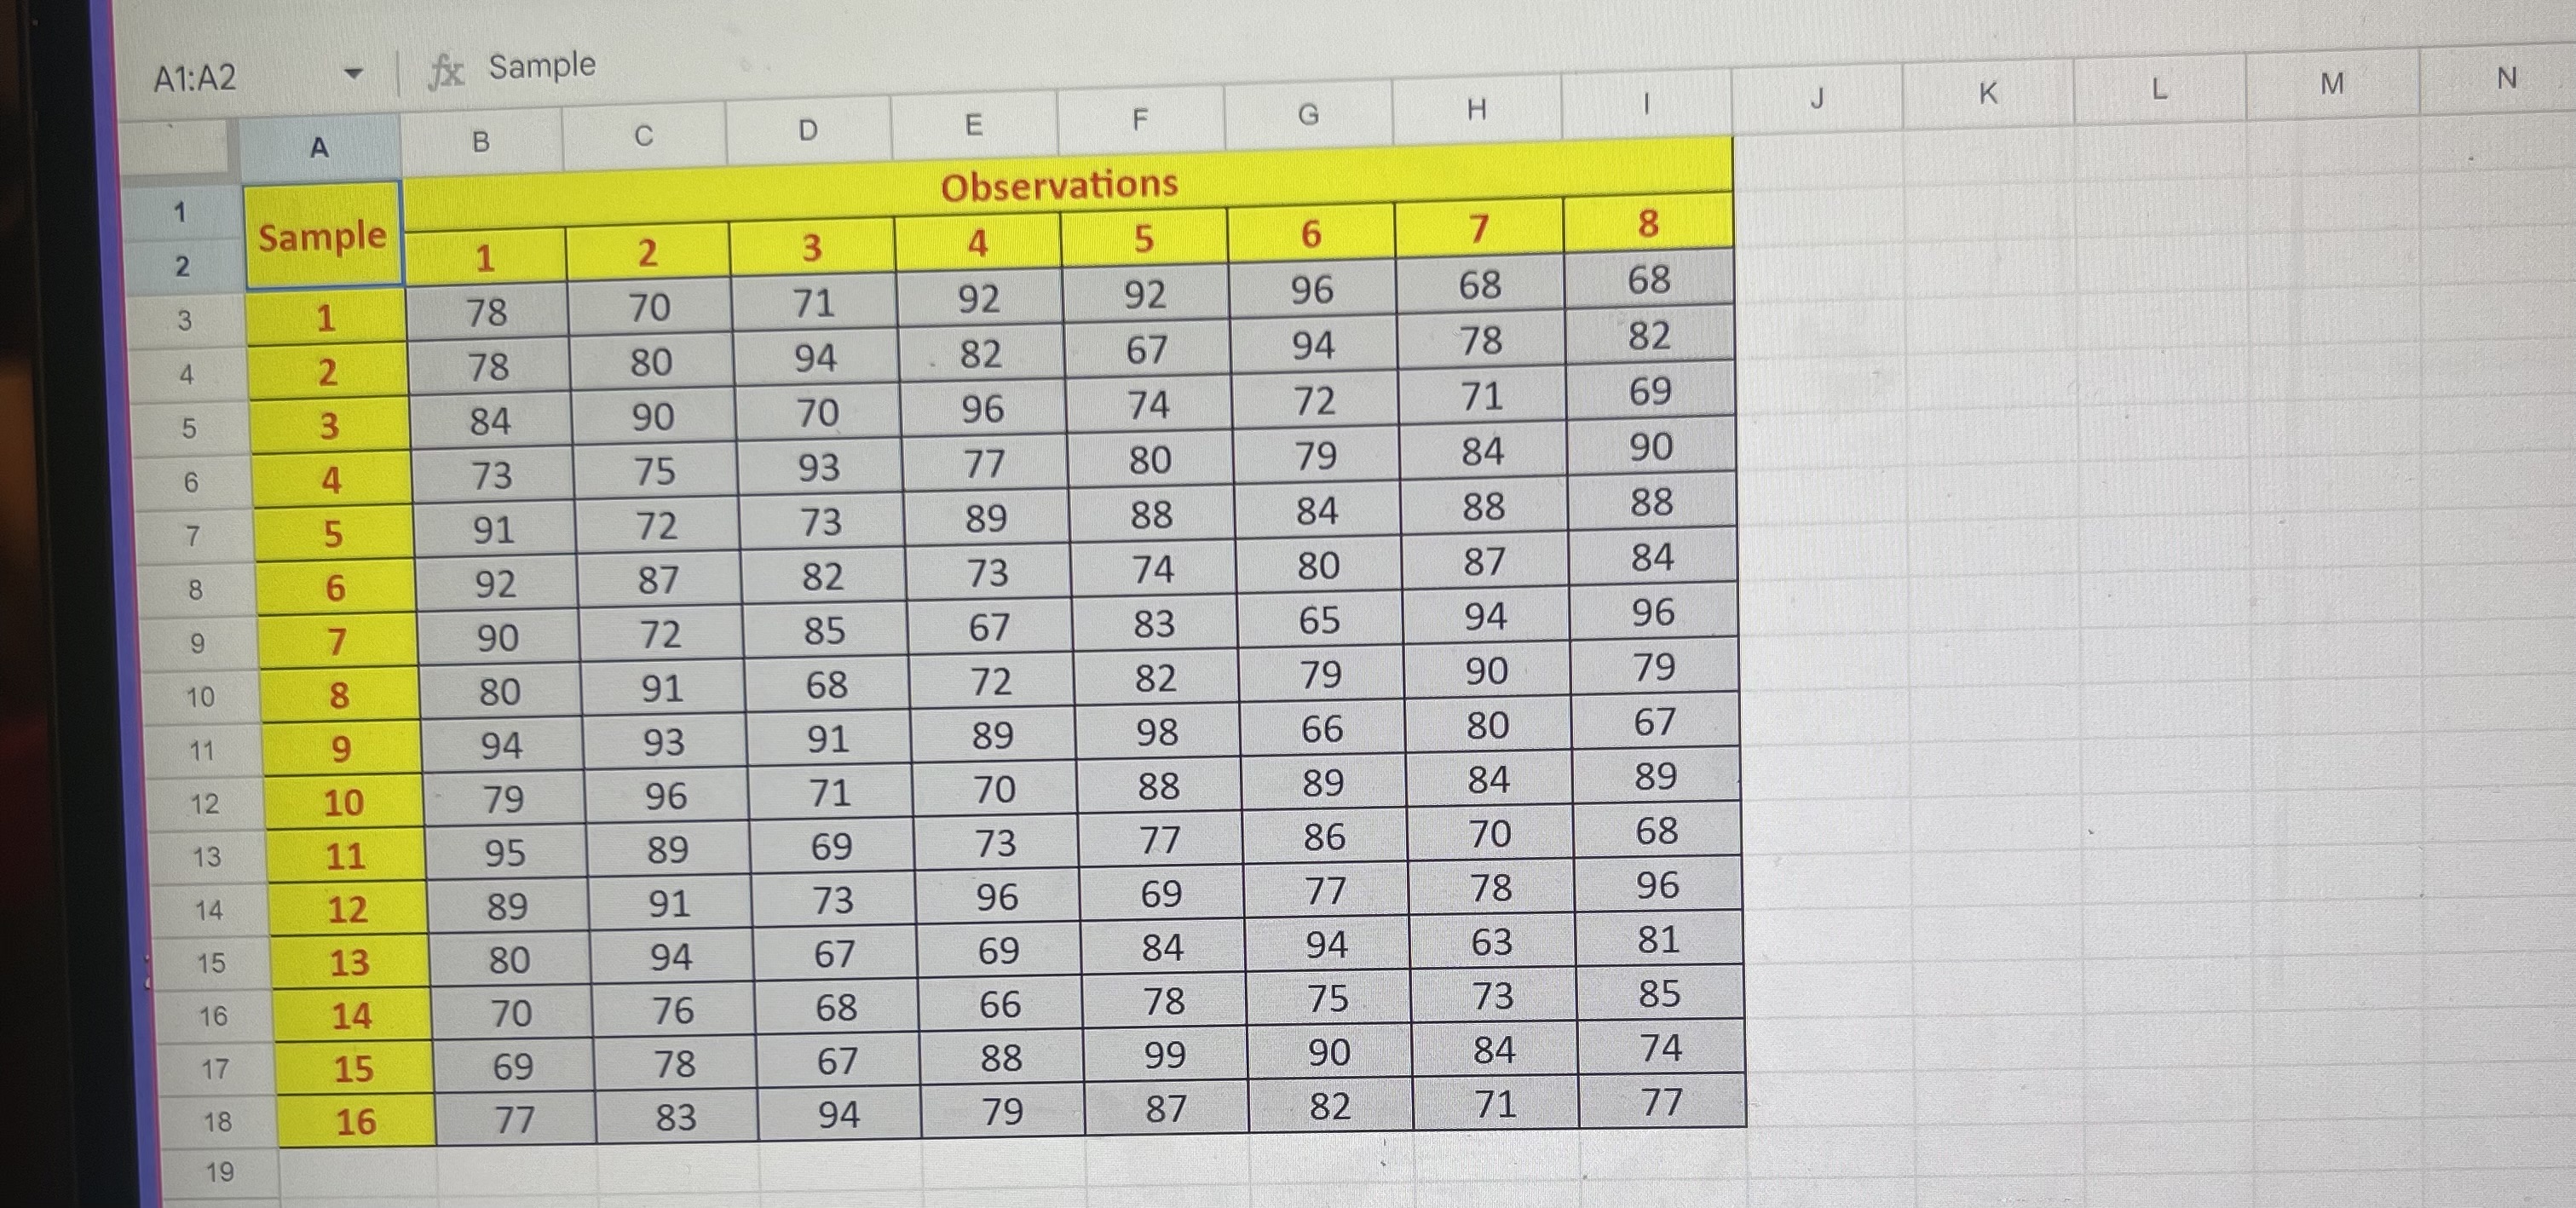
Question: Using the sample of observation in this excel sheet, calculate the following quality & performance metrics for the process under observation. Note that the customer
Using the sample of observation in this excel sheet, calculate the following quality & performance metrics for the process under observation. Note that the customer specifies the two bounds as and Answer questions below using excel sheet.
The upper control limit for Xbar Control Chart is Please enter the numerical value below rounded to two places of decimal, if any
The lower control limit for R Control Chart is Please enter the numerical value below rounded to two places of decimal, if any
The process capability ratio is Please enter the numeric value below rounded to two places of decimal, if any
The process capability index is Please enter the numeric value below rounded to two places of decimal, if any
Step by Step Solution
There are 3 Steps involved in it
1 Expert Approved Answer
Step: 1 Unlock

Question Has Been Solved by an Expert!
Get step-by-step solutions from verified subject matter experts
Step: 2 Unlock
Step: 3 Unlock