

Question: Using the scatter plot below (Amodio et al., 2007), explain what the data indicate and why Pearson's r coefficient is positive (r = .59)
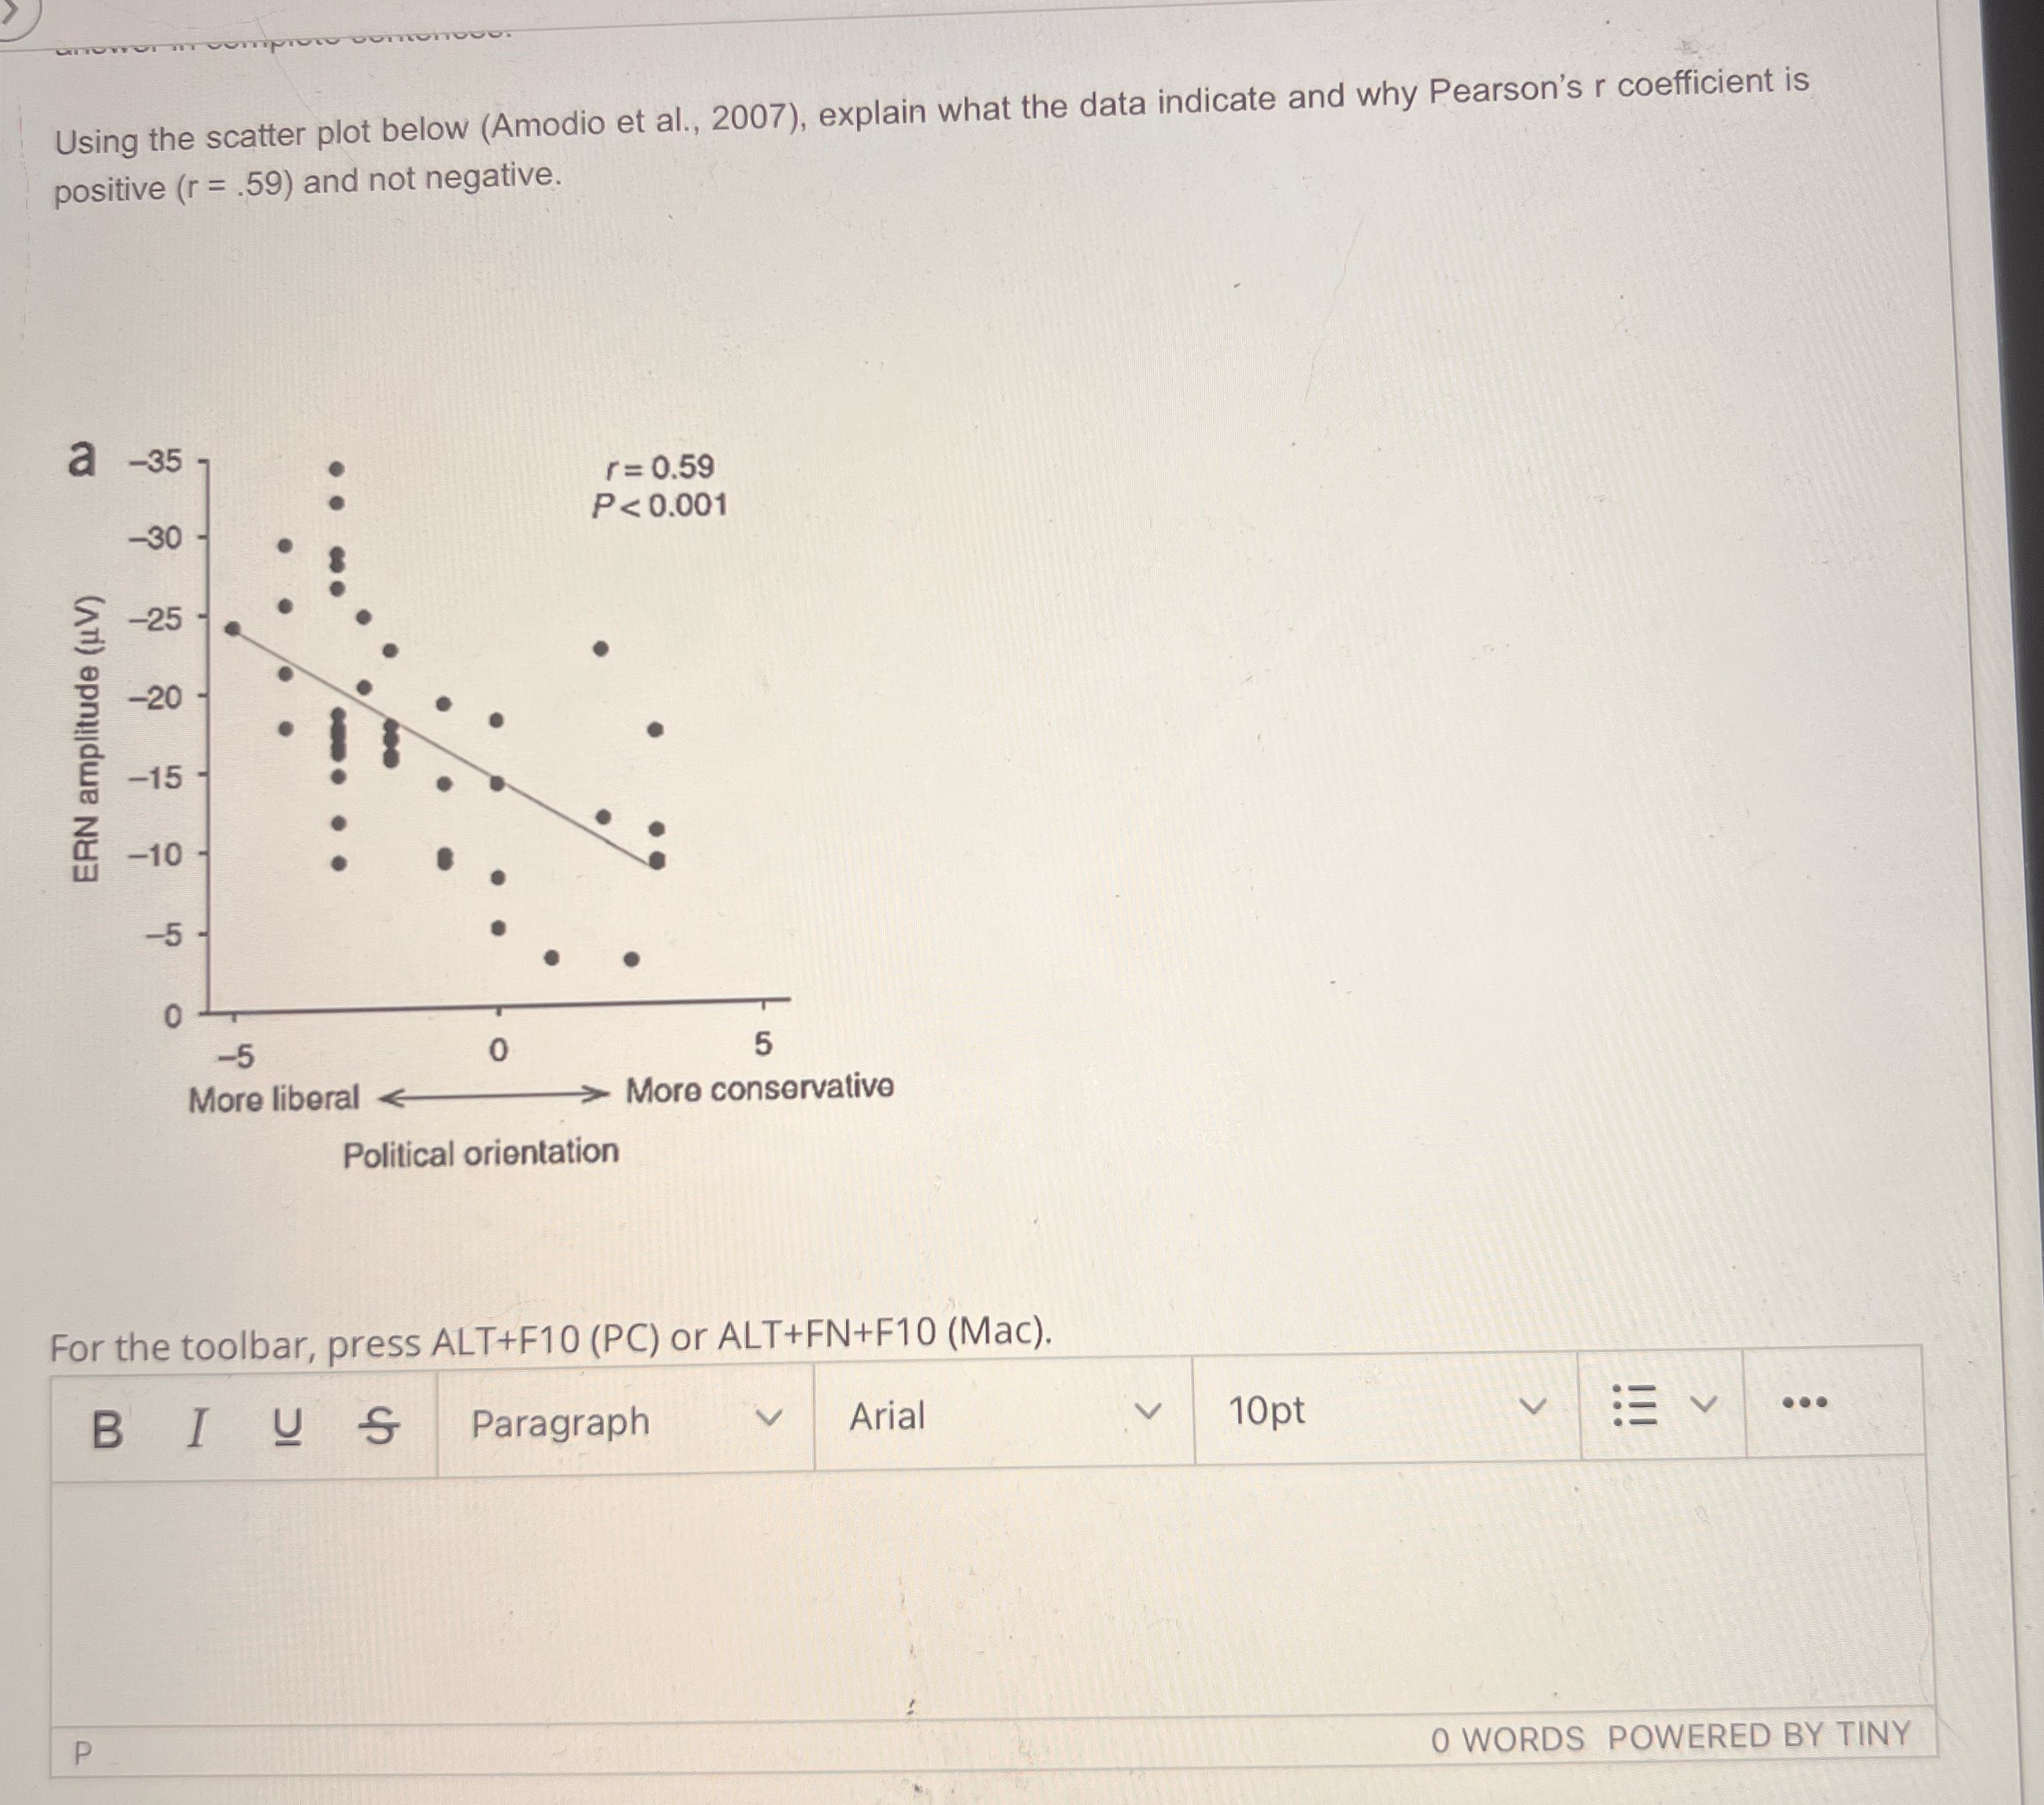
Using the scatter plot below (Amodio et al., 2007), explain what the data indicate and why Pearson's r coefficient is positive (r = .59) and not negative. a -35 ERN amplitude (V) -30 -25 -20 -15 0 WORDS POWERED BY TINY
Step by Step Solution
There are 3 Steps involved in it
1 Expert Approved Answer
Step: 1 Unlock

Question Has Been Solved by an Expert!
Get step-by-step solutions from verified subject matter experts
Step: 2 Unlock
Step: 3 Unlock